

Nicholas J. Paul
INSTITUTIONAL PORTFOLIO MANAGER
Climate change is recognized as one of the preeminent global risks today — with extreme weather having the potential to compound societal stresses that encompass economic disparity, human migration and interstate conflict. This quandary has amplified the planetary emphasis for companies to minimize their carbon exposure, or footprint, in order to reduce the social and economic impact on future generations.

Why there is a need to act now
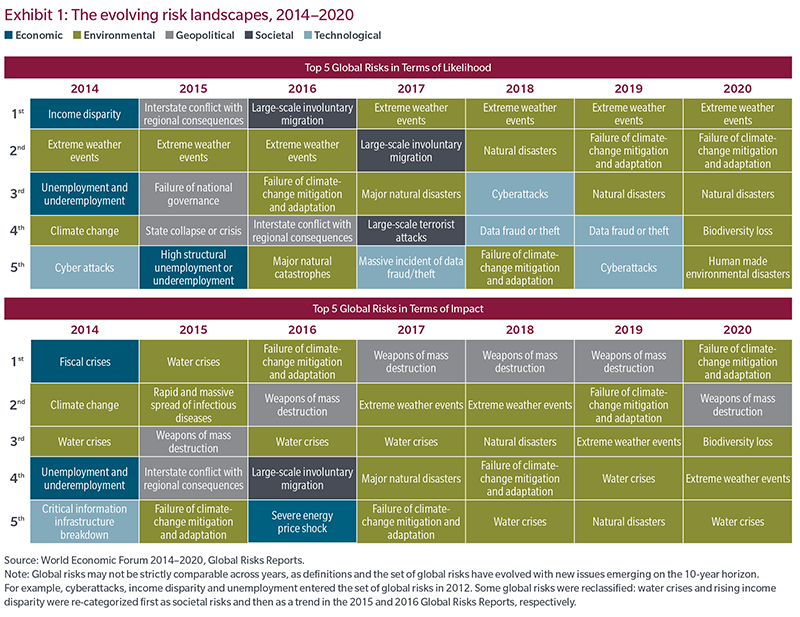
Based on a recent report that surveyed 1,000 experts and global decision-makers, climate change and associated environmental risks account for nine of the top-10 risks to the world today and experts are increasingly concerned that efforts to mitigate the effects of greenhouse gas emissions will fail due to a lack of commitment and investment.1 Key environmental risks include biodiversity loss, extreme weather events and man-made and natural disasters. Experts worry that these are occurring with great frequency and intensity and will continue to have a huge impact both socially and economically. In October 2018, The United Nations Intergovernmental Panel on Climate Change estimated that we have only 12 years to stop temperatures from rising beyond the Paris agreement’s 1.5-degree Celsius target. That report was followed in November 2018 by a national climate assessment conducted by the US government, which warned that average global temperatures could rise as much as five degrees Celsius by the end of the century. Such a rise would make parts of earth uninhabitable, which could lead to insurability issues, potentially causing billions of dollars in economic losses. We detail the evolving economic, environmental, geopolitical, societal and technological risks of climate change over the past seven years in Exhibit 1.
Why carbon is infused into the conversation
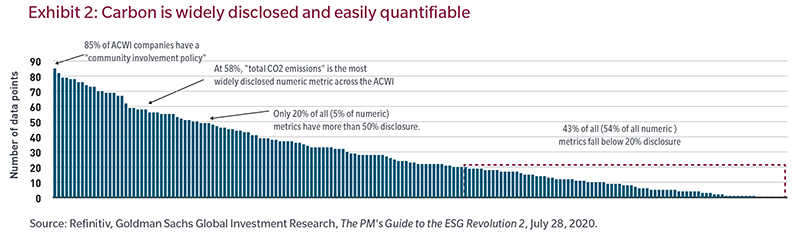
From the framework of a sustainable investment approach, carbon tends to be one data point that is not only reported at a higher rate than most other environmental, social and governance (ESG) metrics, it is also one of the more quantifiable policy-driven ESG measures (see Exhibit 2).
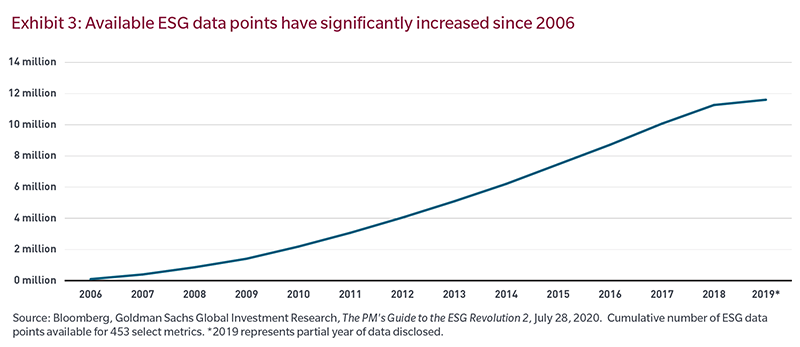
More specifically, in recent years we have witnessed a dramatic expansion in the amount of ESG data and number of ratings available to investors, growing to millions of ESG data points (see Exhibit 3), and a proliferation of ESG research organizations and rating services. In fact, according to the Governance & Accountability Institute, 86% of S&P 500 companies issued some form of social responsibility or sustainability report in 2018, up from just 20% in 2011.2
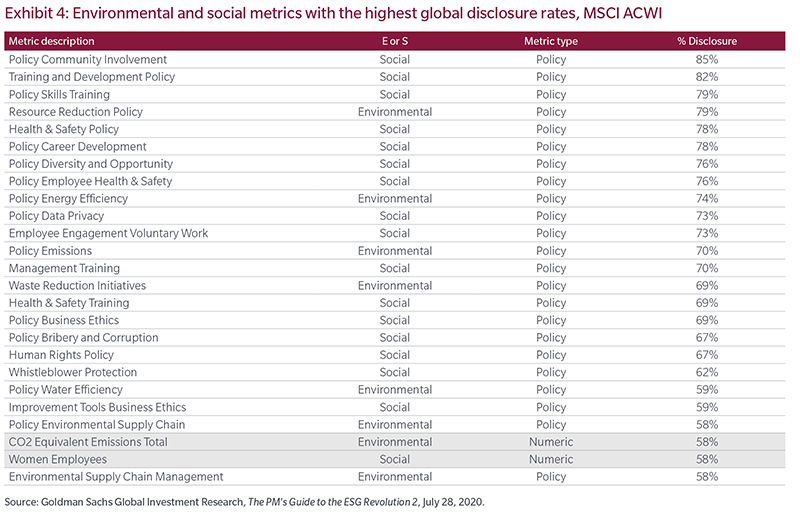
Additionally, according to the Global Initiative for Sustainability Ratings, there are more than 100 organizations dedicated to analyzing and rating company ESG performance. The challenge here lies in the extreme diversity of disclosures, hundreds of industry- or company-specific reporting conventions, and selective or uneven subject matter that makes knowing what to focus on extremely difficult. Carbon, however, is an exception, as it is generally considered the most impactful agent of climate change and extreme weather, and a metric that can be quantified relatively easily compared with other widely disclosed metrics, the majority of which are policy driven and more subjective in nature (as shown in Exhibit 4). Indeed, carbon footprint (or intensity) is the most widely disclosed numeric metric across the broader MSCI All Country World Index.3
Low-carbon investing toolkit: Utilizing a more traditional approach
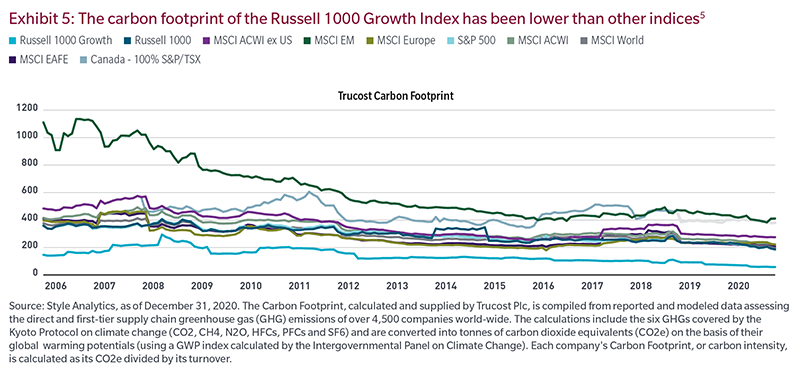
It shouldn’t come as a surprise that the US large-cap growth universe (as measured by the Russell 1000 Growth Index) is particularly well-suited to enable investors to take a more environmentally friendly investment approach while still maintaining exposure to a traditional, well-diversified benchmark. Driven in large part by its makeup of predominantly capital-light businesses, with less exposure to climate change issues, the asset class tends to produce a meaningfully lower carbon footprint when compared with other traditional benchmarks, as shown in Exhibit 5.4 Examples of these businesses, for which intangible assets such as IP and Design factor heavily in valuations, include technology hardware, biopharmaceuticals, medical technology and semiconductors, as well as business and IT services, software, Internet and media.
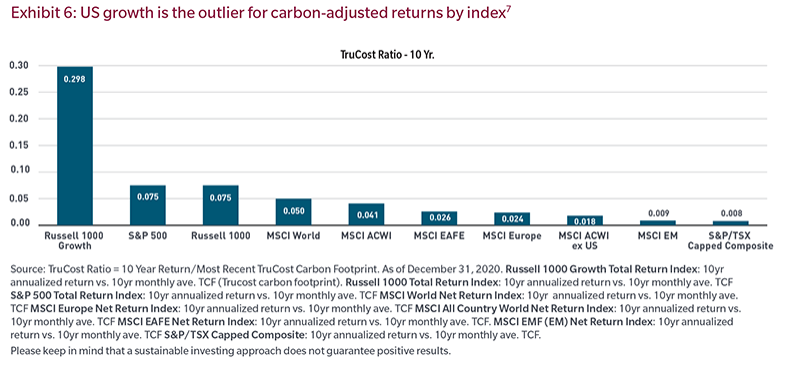
In addition, US large-cap growth equities have delivered the most absolute return per unit of carbon intensity.6 This is illustrated in Exhibit 6, which highlights how the US large-cap growth segment has delivered significantly stronger carbon-adjusted returns relative to other broadbased benchmarks. Further, we believe the innovative businesses found in the US large-cap growth universe are likely to lead the way in the low carbon economy of the future, as these companies should benefit from a combination of policy support, market acceptance, technical advances and cost reductions.
Illuminating a path toward the future
We believe the innovative and forward thinking businesses we find in this universe are also likely to lead the way to the low-carbon economy of the future. These companies should benefit from a combination of policy support, market acceptance, technical advances and cost reduction. A prime example of this is the advancement of Internet of Things (IoT) lighting technology, which includes connected lighting, smart lighting and the internet of lights. While basic connected-lighting capabilities have been available for years, the proliferation of dimmable LED lighting has unlocked additional energy efficiency potential and advanced building automation that has enabled analytics and value-add applications. According to a report by the US Department of Energy, US energy savings attributable to LED lighting could reach 55% to 75% by 2035. A trifecta of qualities — ubiquity, network connectivity and access to power — makes intelligent lights a perfect platform on which the promise of the Internet of Things can come to life. And while building automation technology focused on HVAC and isolated controls was available 10 years ago, now the focus is shifting to sensory networks and integrated platforms enabled by connected LED lighting.
Examples of carbon emission advocacy in action
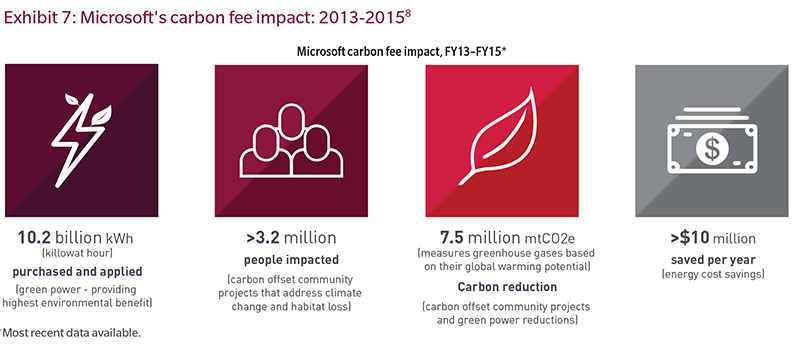
A number of technology companies have taken a more active approach to addressing concerns around carbon emissions and the environment. One prominent example is Microsoft (a large constituent of the US large-cap growth asset class), which, following the Paris Agreement, pledged to cut its carbon emissions 75% by the year 2030. More recently the company furthered this already ambitious goal by pledging to being fully carbon negative by 2030. Microsoft also implemented a carbon fee program in 2012 that made its internal business units financially responsible for their carbon emissions.8 According to the most recent white paper on the subject, the program has reduced emissions by 9.6 million metric tons of CO2, purchased 21 million megawatt-hours of renewable energy and impacted more than 7.5 million people around the globe through carbon-offset community projects. The impact the program had in its first three fiscal years can be seen in Exhibit 7.
Our view of climate change and sustainable investing
At MFS, we utilize a long-term perspective to identify sustainably managed companies that can potentially create long-term value for both shareholders and stakeholders. MFS is aware that climate change could impact corporate revenue growth, margins, returns, cash flows, capital expenditures, valuation and, most importantly, people. Our investment approach involves integrating material ESG factors into our fundamental research and portfolio construction processes with the goal of reducing risk and maximizing financial returns. Our analysts and portfolio managers use proprietary research and tools to assess and model the impact of carbon intensity, asset stranding (obsolete or non-performing)9 and other climate change–related risks and opportunities at the company and portfolio level. We also engage with our portfolio companies to better understand their assessment of climate risk and to share our own ideas.
MFS has been a signatory of the CDP (formerly the Carbon Disclosure Project) since January 2010 and the Principles for Responsible Investing (PRI) since February 2010.10 The CDP is a collaborative engagement initiative that seeks information on the business risks and opportunities presented by climate change, greenhouse gas emissions and other important environmental issues such as water stress and deforestation. Through the data, news, research, and education the CDP provides, we have gained a better understanding of a number of environmental issues. The PRI is the largest and most collaborative initiative that requires its signatories to report on their responsible investing activities and be assessed on an annual basis.
Conclusion
The US large-cap growth universe may provide an opportunity for investors to lower their portfolio’s carbon footprint while maintaining exposure to a traditional asset class. It’s our belief that this could prove a better option as compared to exclusionary, outcome-oriented products hastily brought to market to capitalize on increased investor interest in environmentally responsible investing. Many such products do not benefit from a complete universe of investable securities and have not been tested by a full market cycle. Additionally, we believe innovative businesses in the US large-cap growth universe are likely to lead the way to the low-carbon economy of the future. The lower carbon intensity of these capital-light businesses reduces some of the risks associated with climate change. These companies should benefit from a combination of policy support, market acceptance, technical advances and cost reductions. And while a low-carbon footprint can be viewed as a risk mitigation tool, it can also be viewed as a potential opportunity, as many companies are poised to potentially benefit from climate-change and related legislation addressing what is shaping up to be one of the most pressing issues of our time.
Endnotes
1 World Economic Forum, The Global Risks Report 2020, January 2020.
2 Governance & Accountability Institute, March 2018. Standard & Poor’s 500 Stock Index measures the broad U.S. stock market.
3 The MSCI All Country World Index measures developed and emerging market stock markets.
4 Capital-light businesses, which may include business & IT services, software, Internet, media and medical technology, have historically had a lower carbon footprint than other sectors.
5 Each company’s Carbon Footprint, or carbon intensity, is calculated as its CO2e divided by its turnover.
6 The Carbon Footprint, calculated and supplied by Trucost Plc, is compiled from reported and modelled data assessing the direct and first-tier supply chain greenhouse gas (GHG) emissions of over 4,500 companies world-wide. The calculations include the six GHGs covered by the Kyoto Protocol on climate change (CO2, CH4, N2O, HFCs, PFCs and SF6) and are converted into tonnes of carbon dioxide equivalents (CO2e) on the basis of their global warming potentials (using a GWP index calculated by the Intergovernmental Panel on Climate Change). Each company’s Carbon Footprint, or carbon intensity, is calculated as its CO2e divided by its turnover. Russell 1000® Growth Index measures large-cap U.S. growth stocks. Russell 1000® Index measures large-cap U.S. stocks. Standard & Poor’s 500 Stock Index measures the broad U.S. stock market. MSCI All Country World Index measures developed and emerging market stock markets. MSCI World Index measures stock markets in the developed world. MSCI All Country World (ex-US) Growth Index is a market capitalization index that is designed to measure equity market performance for growth securities in the global developed and emerging markets, excluding the U.S. MSCI EAFE (Europe, Australasia, Far East) Index measures the non-US stock market. MSCI Europe Index measures stocks in European developed markets.
7 Russell 1000® Growth Index measures large-cap U.S. growth stocks. Russell 1000® Index measures large-cap U.S. stocks. Standard & Poor’s 500 Stock Index measures the broad U.S. stock market. MSCI All Country World Index measures developed and emerging market stock markets. MSCI World Index measures stock markets in the developed world. MSCI EAFE (Europe, Australasia, Far East) Index measures the non-US stock market. MSCI Emerging Markets Index measures emerging market stocks. MSCI Europe Index measures stocks in European developed markets.
8 Microsoft Corp., Making an Impact with Microsoft’s Carbon Fee, March 2015.
9 Stranded assets is a financial term that describes something that has become obsolete or nonperforming well ahead of its useful life, and must be recorded on a company’s balance sheet as a loss of profit.
10 MFS may either take actions inconsistent with the PRI or fail to take such actions as would be consistent with the PRI if, in MFS’ judgment, it is in the best economic interests of its clients to do so.
Frank Russell Company (“Russell”) is the source and owner of the Russell Index data contained or reflected in this material and all trademarks, service marks and copyrights related to the Russell Indexes. Russell® is a trademark of Frank Russell Company. Neither Russell nor its licensors accept any liability for any errors or omissions in the Russell Indexes and/or Russell ratings or underlying data and no party may rely on any Russell Indexes and/or Russell ratings and/or underlying data contained in this communication. No further distribution of Russell Data is permitted without Russell’s express written consent. Russell does not promote, sponsor or endorse the content of this communication.
Index data source: MSCI. MSCI makes no express or implied warranties or representations and shall have no liability whatsoever with respect to any MSCI data contained herein. The MSCI data may not be further redistributed or used as a basis for other indices or any securities or financial products. This report is not approved, reviewed or produced by MSCI.
“Standard & Poor’s®” and S&P “S&P®” are registered trademarks of Standard & Poor’s Financial Services LLC (“S&P”) and Dow Jones is a registered trademark of Dow Jones Trademark Holdings LLC (“Dow Jones”) and have been licensed for use by S&P Dow Jones Indices LLC and sublicensed for certain purposes by MFS. The S&P 500® is a product of S&P Dow Jones Indices LLC, and has been licensed for use by MFS. MFS’s Products are not sponsored, endorsed, sold or promoted by S&P Dow Jones Indices LLC, Dow Jones, S&P, or their respective affiliates, and neither S&P Dow Jones Indices LLC, Dow Jones, S&P, their respective affiliates make any representation regarding the advisability of investing in such products.
The views expressed are those of the author(s) and are subject to change at any time. These views are for informational purposes only and should not be relied upon as a recommendation to purchase any security or as a solicitation or investment advice from the Advisor. No forecasts can be guaranteed.