

In our Navigating Asia’s ESG data puzzle article, we noted that data is often seen as one of the biggest obstacles in integrating ESG into the investment decision making process. Some of the most cited concerns include inconsistencies among rating agencies, lack of clarity around standards and metrics as well as insufficient data to make informed decisions.
Not all ESG data are made equal, and not all ESG rules and regulations are clearly defined. Nonetheless ESG investing is here to stay with “E” taking centerstage for many investors as the climate impact is forecasted to hit most regions the hardest. As such, we think integrating carbon metrics into the investment decision-making process and striving for an improvement in a portfolio’s carbon intensity score may be a good starting point if it is aligned to investors’ beliefs or preferences.
Why carbon intensity matters
Carbon intensity is defined as the amount of carbon emissions caused by a company (metric tons of CO2) divided by its revenue (in USD millions). This figure measures the amount of greenhouse gas that a company emits relative to the sales it generates from these emissions. One reason we feel this is one of the more easily adopted ESG metrics is that it is relatively more objective and less susceptible to manipulation compared to other more qualitative ESG metrics.
As net-zero emissions targets are embraced globally and as ESG investing gains popularity, more companies are reporting their carbon emissions, therefore making this measure more comparable across companies. The increased focus on these metric disclosures also provides a degree of industry self-policing to ensure fair and non-exaggerated company disclosures. In terms of importance, as countries and companies commit to reducing their carbon footprints, we also expect a rise in demand for lower-carbon portfolios.
Data distribution shows up the skew effect
In this article, we use the carbon emissions data provided by MSCI, measured by Scope 1 and Scope 2 carbon intensity data. Scope 1 data measures direct greenhouse gas emissions from the company’s activities, whereas Scope 2 refers to indirect emissions arising from the electricity the company consumes.
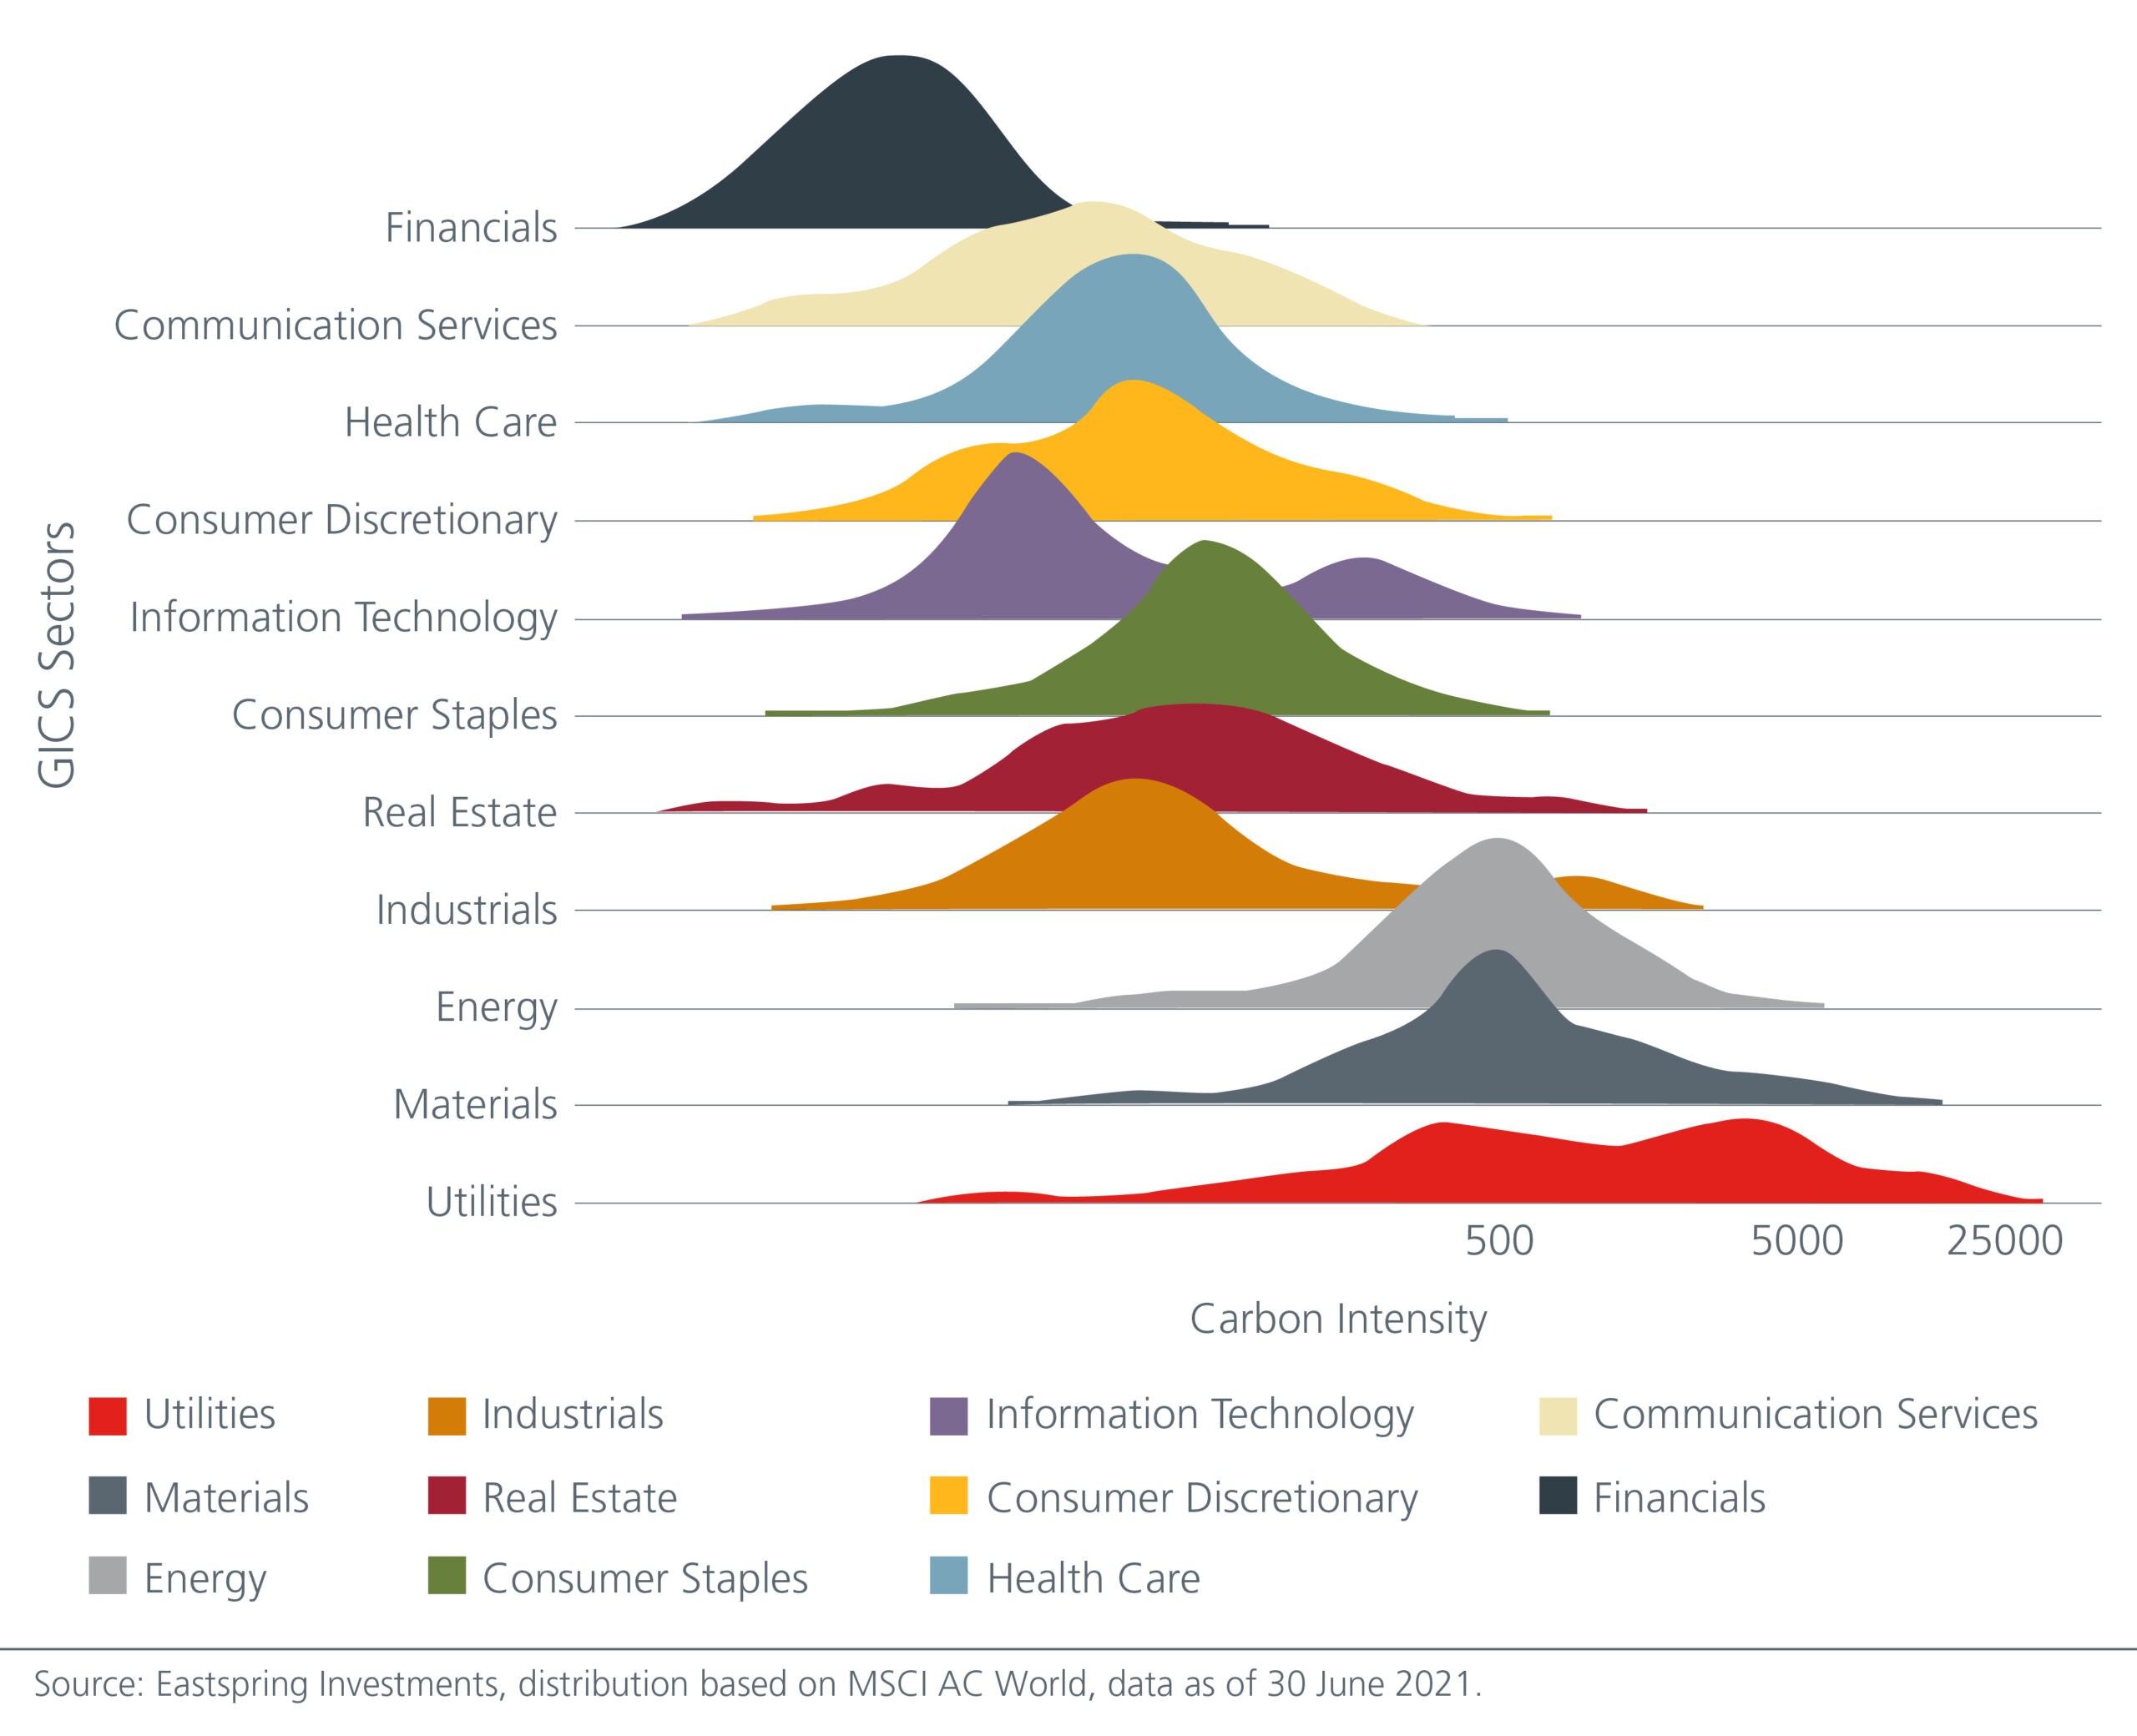
Looking at the distribution of carbon intensity data for all companies in the MSCI AC World index, we observe that companies in the Energy, Materials and Utilities sectors have higher carbon emissions compared to the other sectors. See Fig 1. This is not surprising. In addition, there are more outliers in these sectors – notice the x-axis is compressed – with some companies having a score as high as 25,000.
Fig 1: Distribution of carbon intensity by sector
The potential pitfalls of a simple exclusion approach
To illustrate this, imagine you are a portfolio manager and a client has asked for a low-carbon global portfolio. Given what we have discovered, one possible way of lowering a portfolio’s weighted average carbon intensity (WACI) is to simply exclude the outliers in the portfolio.
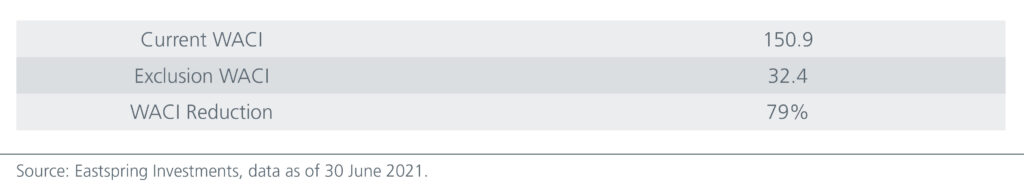
Using the MSCI AC World index as a starting point, it has a WACI score of 150.9 as of end-June 2021. See Fig 2. Let us consider a screening approach by ranking the stocks in the index based on their contribution to the total WACI score. We then exclude the top 10 percent and reweight the rest.
Due to the skewed distribution we observed above, even just removing 10 percent of the top WACI contributors had an outsized impact on the final score. We managed to reduce the WACI score by almost 80 percent. Job done and the client is satisfied.
Fig 2: WACI score illustration
Sure, this approach may have achieved a lower carbon portfolio, but did it have any unintended effects on the portfolio?
This simple exclusion approach would typically lower the sector weights for Utilities, Energy and Materials as these sectors tend to have the highest carbon intensity scores. In general, Utility companies tend to have a higher dividend yield than many other sectors and are normally perceived as lower volatility. This approach, therefore, would likely lead to a lower yielding portfolio with a higher tracking error and higher volatility, offsetting some of the benefits of owning a lower carbon portfolio.
The appeal of a quant approach
Let us consider a more nuanced approach. In a quantitative strategy, we start with a universe of stocks and apply appropriate filters (such as liquidity, market capitalization, dividend yield, value screens, etc.) to derive a list of investible names. From this list, we then look for an optimised solution for some specified objective – maximising expected return or minimising expected portfolio volatility, for instance – that also satisfies specified constraints, such as a target dividend yield or relative sector and country weights against the benchmark.
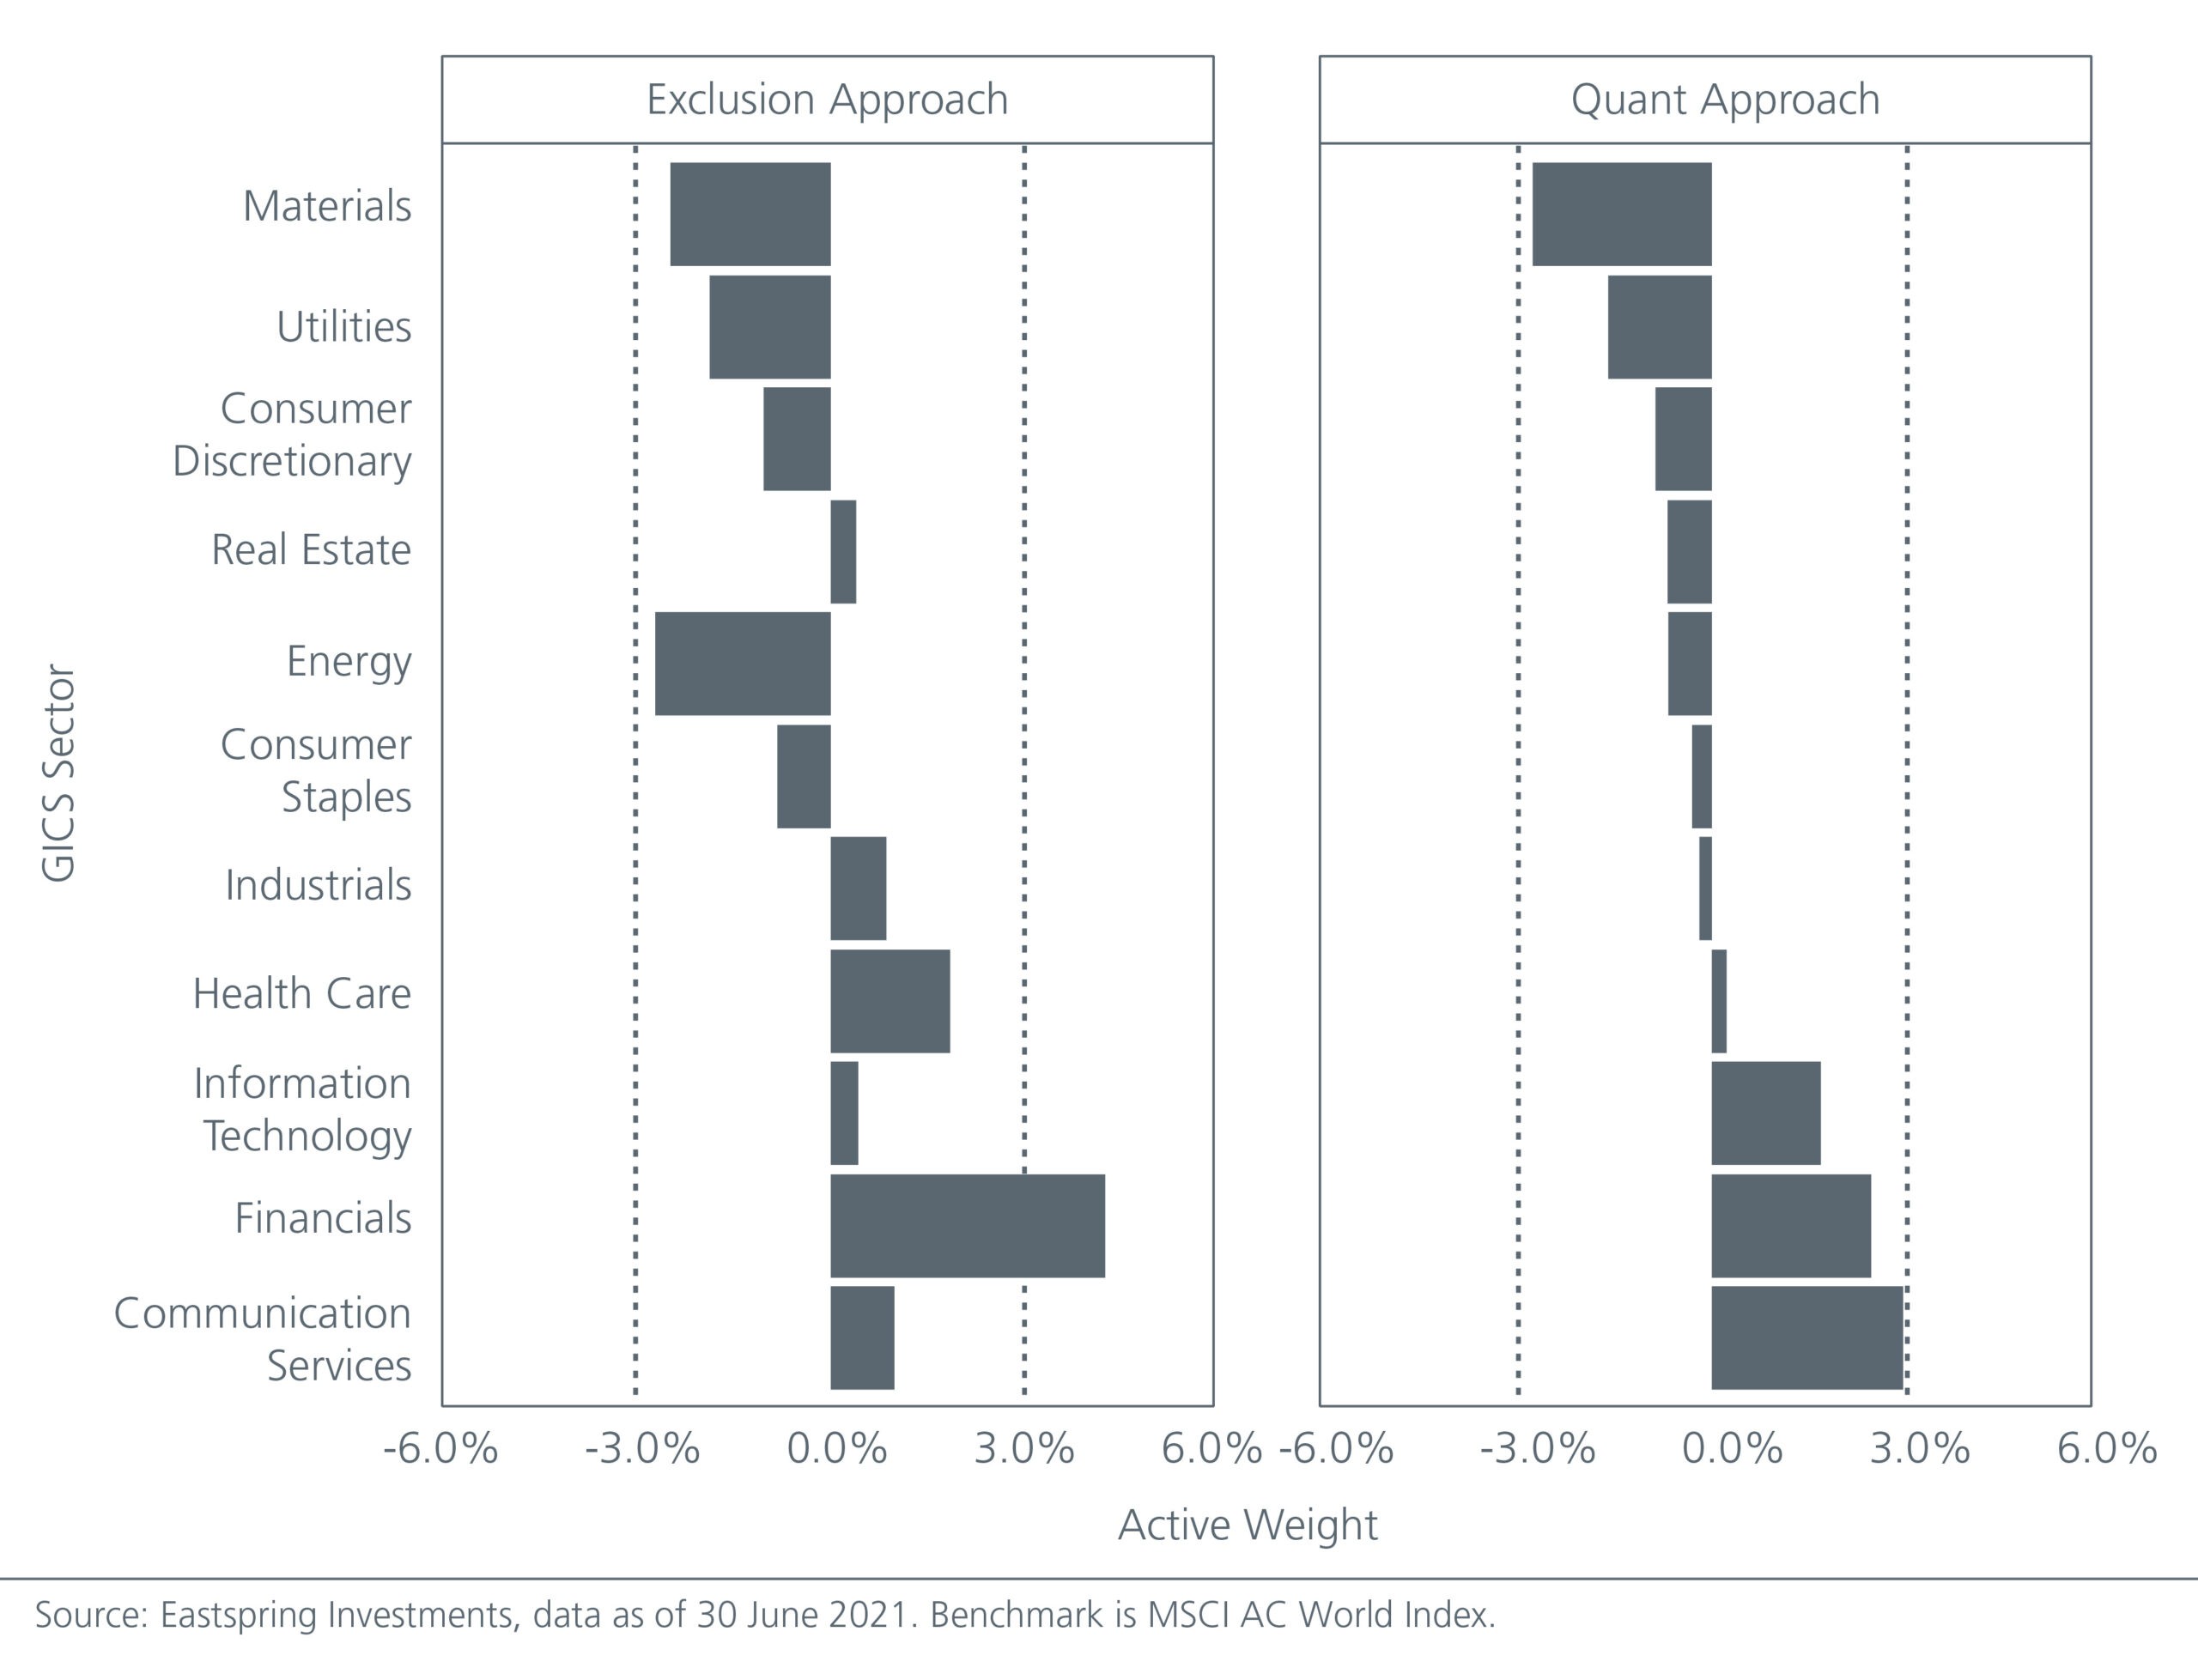
To demonstrate this, we use the MSCI AC World index as the target (benchmark) and use an optimisation approach to ensure the final portfolio meets certain objectives and constraints relative to the benchmark, including the desired reduction in carbon intensity. The optimisation objective is set to minimise the expected portfolio volatility, bounded by constraints such as a final WACI score of 30 and a low tracking error against the benchmark. We also set relative-weight bands for countries and sectors to ensure we would not be significantly underweight or overweight certain sectors. The result: we can construct a portfolio with more attractive characteristics than the exclusion approach above, while ensuring that we are not significantly skewed in any sector. See Fig 3 and Fig 4.
That said, the optimiser approach is not without its pitfalls. For instance, if the constraints are too restrictive and the universe is not sufficiently large, it may not be feasible to find a portfolio that satisfies all the criteria. In that case, managers may sometimes have to apply judgement to relax certain restrictions.
Fig 3: Comparing metrics across the different approaches
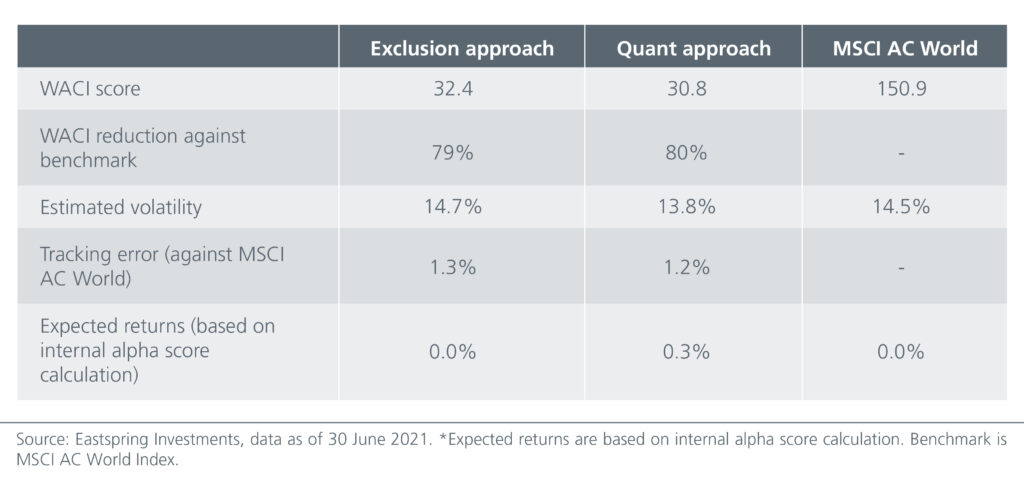
Fig 4: Active weight against benchmark
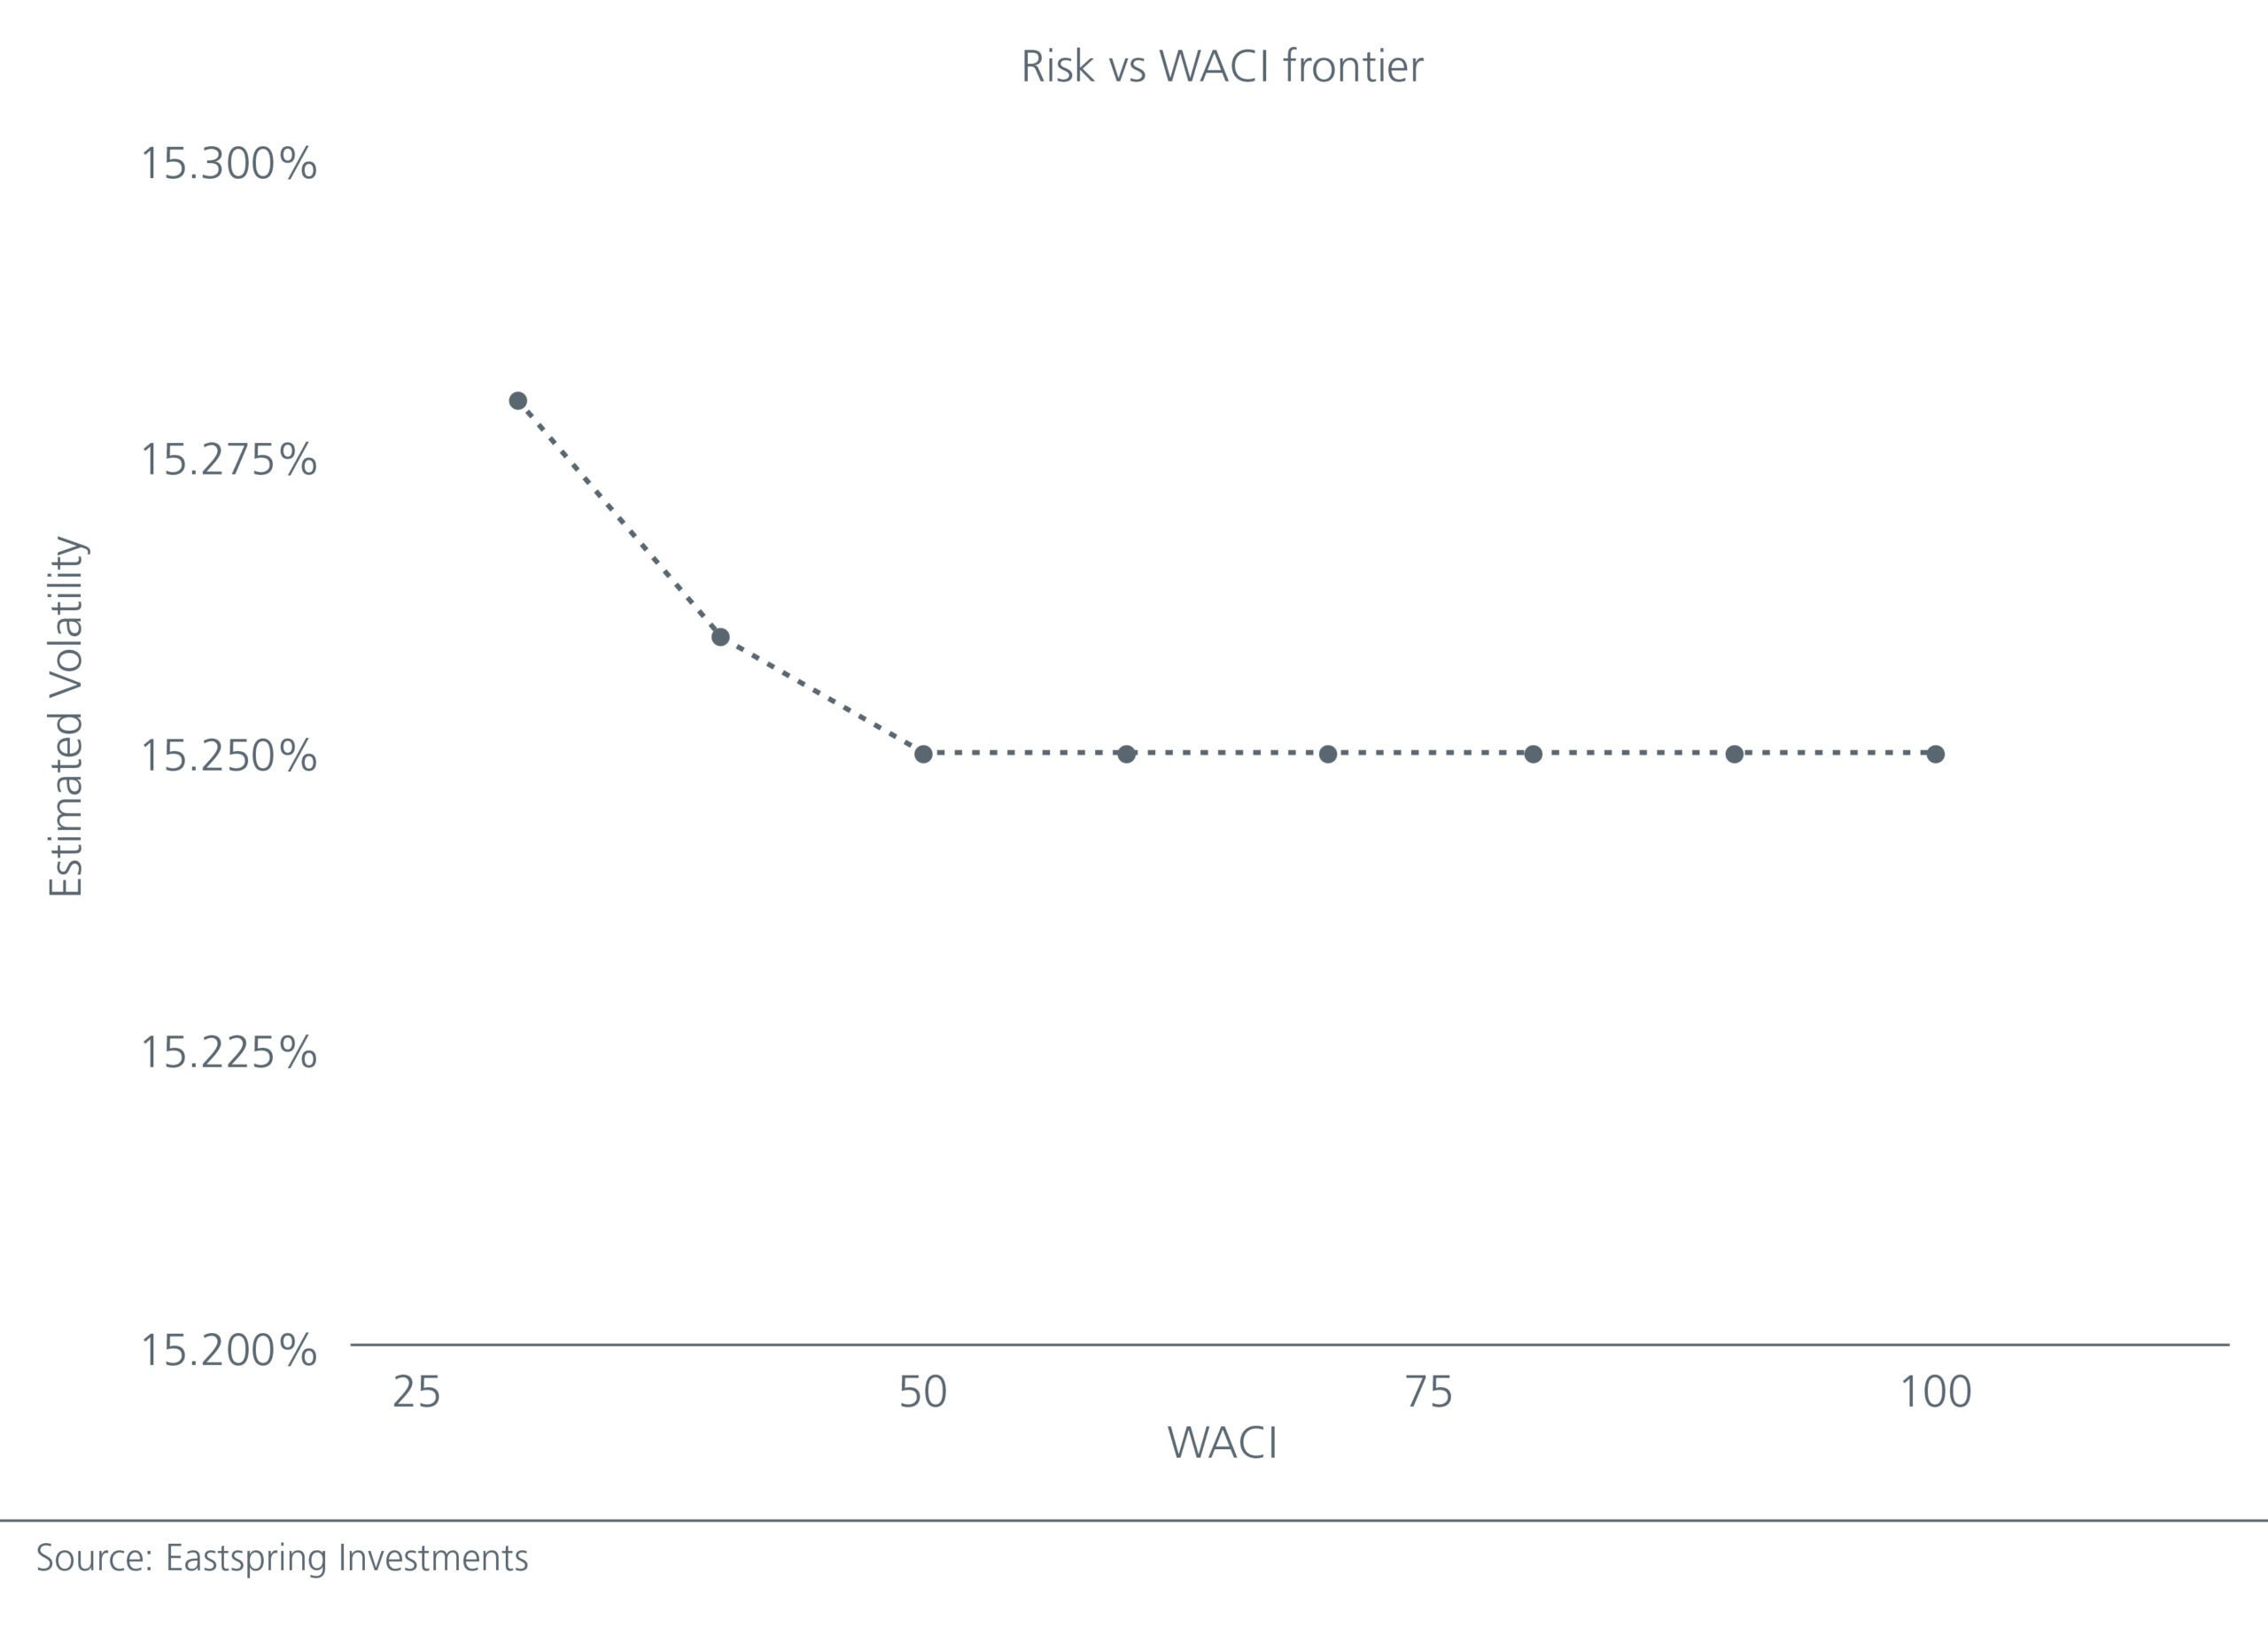
An additional benefit of using a quant approach is that it is more flexible. For example, we can map out an efficient frontier showing the potential optimised portfolios for various constrained levels of WACI. The trade-off between reducing the carbon intensity of the portfolio and the ability to reduce expected volatility then becomes apparent. See Fig 5. In this case, we see that there are some points along the frontier where we could effectively lower the portfolio’s carbon intensity score without increasing the portfolio’s volatility. The portfolio manager can decide the point along the frontier that jointly satisfies the need for both risk and ESG considerations.
Fig 5: Risk vs WACI efficient frontier
In this way, we may view any portfolio that seeks to integrate one or more ESG metrics as a customised portfolio. As a quantitative approach can construct a portfolio at any point along the efficient frontier, it is well-suited for building such customised portfolios to meet clients’ ESG needs.
Beyond a single carbon metric
Reducing a portfolio’s exposure to a single carbon metric is obviously just a starting point. Carbon intensity data is by no means the only way of measuring a portfolio’s greenhouse gas emissions. Moreover, we did not consider Scope 3 emissions, which capture indirect emissions along the company’s supply and distribution chain. Nor have we addressed the myriad of other ESG data metrics that extend beyond carbon emissions.
Driven by the rapid increase in awareness surrounding ESG issues, we believe the ESG data landscape has improved for quantitative investors as more comprehensive, reliable and comparable datasets have become available. With the exponential increase in ESG data in terms of both volume and categories, a quantitative approach could provide an effective method for integrating ESG into the investment process.