

While many investors grimaced at the recent inversion of the U.S. Treasury curve, Head of Global Asset Allocation Ashwin Alankar believes it should be taken as a sign that the market views the Federal Reserve’s (Fed) inflation-fighting tactics as credible.
Key Takeaways
- The early-month inversion of the U.S. Treasury yield curve sounded the alarm that a slowing economy – or recession – may be on the radar.
- We, instead, interpret a flattening yield curve as the Fed not having lost credibility with the market as it attempts to rein in inflation.
- Even as we exit the era of extreme accommodation, real interest rates, as measured by forward markets, appear set to remain below 1.0% for quite some time.
The recent trend by the market to frame new developments in a negative light received an assist early this month when the yield of the 2-year U.S. Treasury note briefly rose above that of the 10-year. This was the first inversion between these two maturities since a blip during the height of the 2019 U.S.-China trade war. On cue, bears emerged from hibernation, calling for imminent recession. The driver of inversion was the Federal Reserve’s hawkish about-face as it grapples with 6.4% year-over-year core inflation. With the U.S. central bank having more-than doubled its own expectations for the number of 25 basis point rate hikes in 2022 – from three last December to seven at its March meeting – investors grew concerned that the Fed would live up to its reputation as the killer of expansions.
We interpret the inverted yield curve differently. Much of the market’s consternation is premised on the notion that the Fed has lost credibility due to its glaringly bad call on transitory inflation and taking its eye off its dual mandate by also prioritizing asset prices. But if the market thought the Fed had truly lost its way, we’d now be witnessing a steepening – not a flattening – yield curve. The fact that yield increases on Treasuries with maturities of 5 years and longer have not kept pace with the 2-year, in our view, means that the market sees the Fed’s approach to controlling inflation as credible. Even when taking into consideration the Fed’s newfound inflation-fighting chops, forward markets imply that real rates (nominal yields minus inflation) will remain very accommodative – likely well below 1.0%. Implicit in these market signals is the idea that not only should the Fed make inroads in combating inflation, but it can do so without condemning the U.S. economy to certain recession as it begins carefully tapping the brakes on the economy.
10-Year – 2-Year U.S. Treasury Yield Spread
A flattening yield curve, as illustrated by the narrowing of spreads between 10-year and 2-year Treasury yields, implies that the market believes the Fed is serious about combating accelerating inflation.
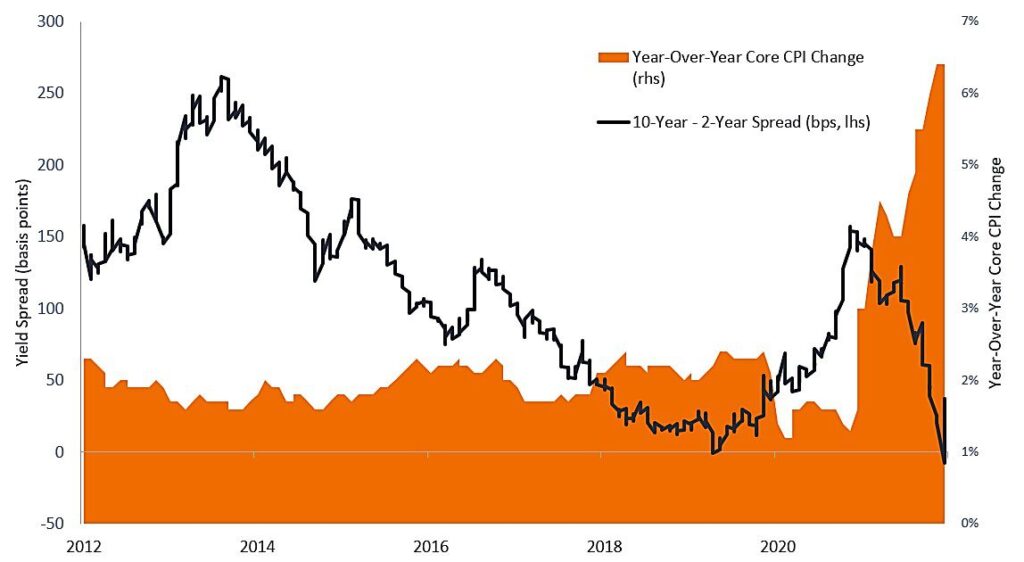
Note: Spread measures the difference in yield between securities.
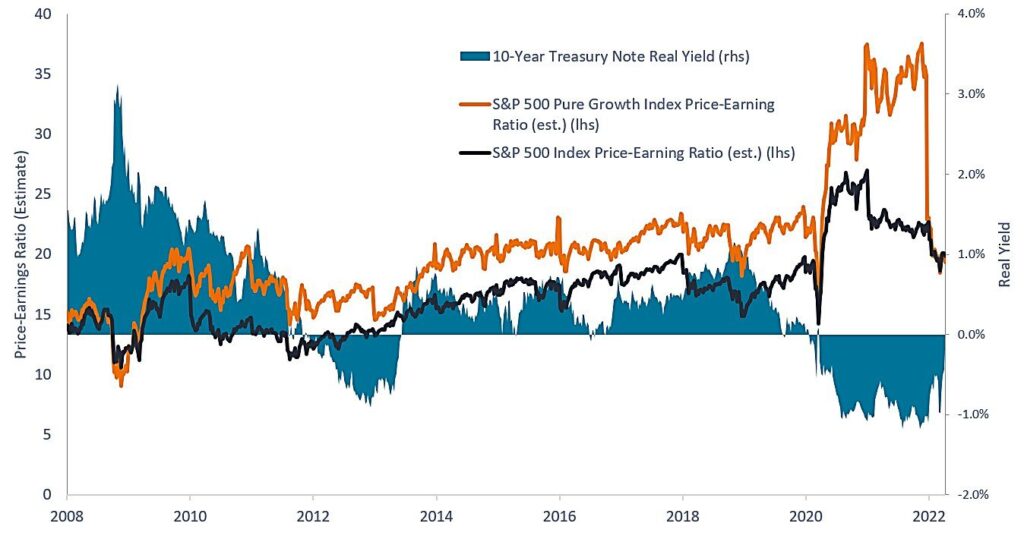
Decade of Valuation Multiple Expansion Driven by Low Real Rates
Price-earnings ratios have largely expanded since the Global Financial Crisis as real borrowing costs for corporations remained mired in low – and sometimes negative – territory.
Russell 1000® Growth Index reflects the performance of U.S. large-cap equities with higher price-to-book ratios and higher forecasted growth values.
Standard Deviation measures historical volatility. Higher standard deviation implies greater volatility.
Consumer Price Index (CPI) is an unmanaged index representing the rate of inflation of the U.S. consumer prices as determined by the U.S. Department of Labor Statistics.
The discount rate represents the interest rate used to determine the present value of future cash flows.
Price-to-Earnings (P/E) Ratio measures share price compared to earnings per share for a stock or stocks in a portfolio.
A yield curve plots the yields (interest rate) of bonds with equal credit quality but differing maturity dates. Typically bonds with longer maturities have higher yields.
An inverted yield curve occurs when short-term yields are higher than long-term yields.
These are the views of the author at the time of publication and may differ from the views of other individuals/teams at Janus Henderson Investors. Any securities, funds, sectors and indices mentioned within this article do not constitute or form part of any offer or solicitation to buy or sell them.
Past performance does not predict future returns. The value of an investment and the income from it can fall as well as rise and you may not get back the amount originally invested.
The information in this article does not qualify as an investment recommendation.
Marketing Communication.