

Boston & New York – Investors have been building bond portfolios using a laddered strategy since the early 1900s at least. Even in a flat or rising rate environment, a bond ladder’s total return may exceed its starting yield through the phenomenon of roll-down. The benefits of roll-down relate directly to the shape of the yield curve. Given the current steepness of the curve, this pickup could be as much as an additional 1% per year.
Let’s demystify the roll-down effect with a few intuitive examples and as little bond math as possible.
Stocks, which have great potential.
China’s ‘new economy’ is the result of the current strategic plan to make China more technologically self-sufficient and of the Chinese Communist Party’s 2021- 2035 development plan. Based on consumption, technological innovation, health, and urbanisation, it is the new driver of growth for a country whose economy used to depend on foreign investment and exports. It should enable China to generate more sustainable and environmentally friendly growth.
By being selective in our investment choices, we can exploit the potential of China’s economy, which now accounts for over 40% of global economic growth, and of the long-term reforms that have been launched in terms of health insurance, retirement, and increased purchasing power etc. Innovation, in particular, will play a key role in driving the country’s future growth, which is already a leader in many fields such as 5G, biotechnology, robotics, and online payments.
The Basics: The Yield Curve and a Laddered Portfolio
To begin, let’s remember that the Yield Curve refers to the relationship between years-to-maturity and the average yield for all bonds in a sector of the fixed income market. For the U.S. Treasury bond market, the yield curve is sometimes referred to as the term structure of interest rates. When the yield curve is sloped positively, investors receive additional yield for extending into a longer maturity bond; thus a five-year bond would yield more than a four-year bond, which would yield more than a three-year bond, and so on. A positively sloped curve has been the historical norm for municipal and corporate bonds even in periods when the Treasury yield curve was inverted.
A Laddered Portfolio has equal exposure to each maturity year that an investor selects. Bonds either mature or are sold when their maturity falls below the shortest maturity in the range. Proceeds are then reinvested at the longest maturity in the range. (Note that on rare occasions, in practice, we might fill a gap in a ladder before investing in the longest maturity.) Since ladder reinvestment occurs at the longest maturity, it will be at the highest-yielding maturity in a positively sloped yield curve.
The steeper the curve, the greater the difference between the average yield of the portfolio and the highest-yielding maturity. Over time, reinvestment should result in an increase in the yield of the portfolio.
Today's Yield Curve
There is growing concern among investors that a combination of accommodative monetary policy, another round of fiscal stimulus, the roll-out of the vaccine and pent-up demand may lead to higher inflation. Expectations of higher inflation have pushed up longer-term U.S. Treasury rates, which are nearly 100 basis points (bps) higher in June than the record lows of last August.
Corporate bonds are priced at a spread over Treasurys to compensate investors for credit risk. In general, corporate bond spreads increase as maturities lengthen, so investors are paid more for taking credit risk over a longer time. This results in corporate bond curves that are even steeper than in the Treasury market.
Though tax-exempt municipal bonds are not priced at a spread over Treasurys — and the relationship will fluctuate with the perceived value of tax-exempt income — they exhibit the same sort of credit-spread relationship to their AAA benchmark as corporate bonds do to Treasurys. Issuer yield curves get steeper moving down the credit spectrum. With tax increases anticipated, municipals may have outperformed Treasurys, but overall, like corporates, muni curves remain steep.
How to Consider Roll-Down
Like a car engine, a diversified bond portfolio has a lot of moving parts. To best demonstrate how roll-down works, we want to simplify things. For the purposes of explanation, we can begin with a hypothetical example of a 1-10 year laddered portfolio where we hold interest rates constant, so the yield of each bond in the ladder equals its coupon rate at the time of purchase.
To help understand the roll-down, let’s consider how a bond’s yield and price change over time. The initial yield on each bond in the hypothetical ladder is its coupon rate. Absent a default, that’s the annual return an investor would earn by holding that bond to maturity. Again, when the slope of the yield curve is positive, a bond in the 10-year maturity rung of the ladder would have a higher yield (coupon rate) than a bond in the nine-year maturity rung.
After one year with rates unchanged, that 10-year bond would have shortened to a nine-year bond; because its coupon rate now exceeds the nine-year yield, investors would be willing to pay more for the bond, and its price rises. In another unchanged year, it would become an eight-year bond paying a 10-year coupon, and so on.
Let’s look more closely at what happens with our hypothetical 1-10 year A-rated ladder assuming an average yield of 1.3%:
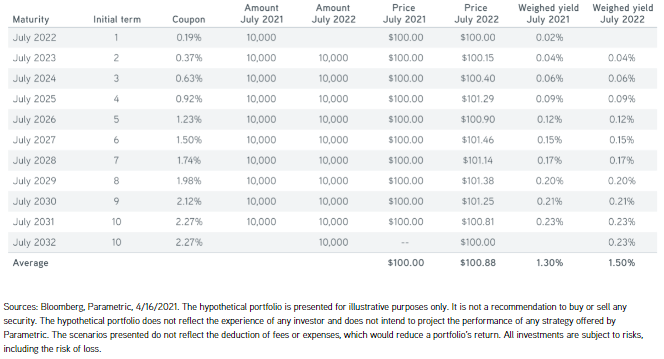
After one year, the first rung of the ladder will mature, and the proceeds will be reinvested into a bond maturing in 2032. In our hypothetical example, interest rates have not changed. Our 2023 maturity, formerly a two-year bond, will now be a one-year bond, but it will still pay the original coupon of 0.37%. The proceeds from the 2022 maturity will be reinvested into a 2032 maturity at 2.27% — the same 10-year rate as the previous year. Rates haven’t moved, but our average yield will go up to 1.5%. Note that the bond now in the nine-year maturity rung continues to pay its original coupon, which like all the other bonds held in the ladder is higher than the yield required at that point along the yield curve, so its price rises.
Generally, a bond’s price will increase as it rolls down the yield curve before maturity. In this hypothetical example, a ladder’s total return will exceed its initial yield as a result of the roll-down and reinvestment effects.
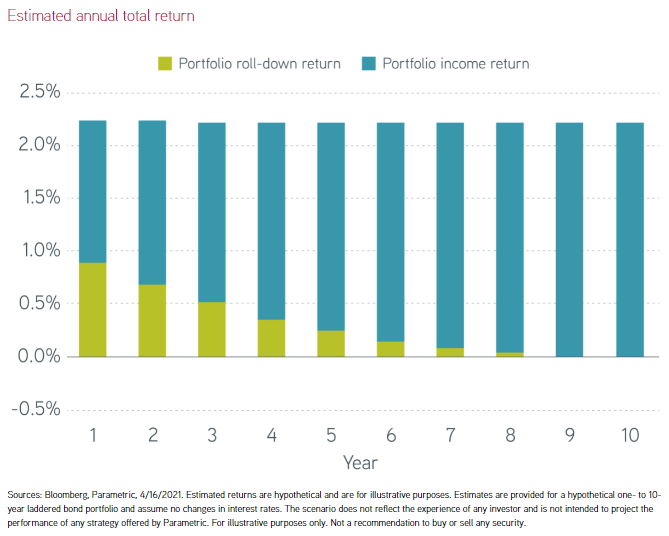
Consider what would happen in our example if rates never moved. Every year, reinvestment would occur at the original 10-year yield of 2.27%, and the portfolio average yield would move toward that rate as more and more bonds carried that book yield. The yield on a laddered portfolio would migrate toward that of the reinvestment, as shown below:
Roll-Down and Price
Because bond prices rise as yields fall, roll-down can manifest itself in terms of the market prices of a laddered portfolio. When the two-year bond in our hypothetical example rolls down to a one-year bond, it will be priced at a premium because it pays 0.37%, compared with a newly issued one-year bond yielding only 0.19%.
With a positively sloped curve, the roll-down should result in price appreciation. In the real world, where interest rates do move, this price appreciation can help to offset some or all negative impact of higher rates (lower market prices) on a portfolio. Remember, too, that higher rates mean higher reinvestment yields.
An investor might be tempted to say, so what? Any price appreciation will disappear, because each bond will mature at par, right? While that would true if an investor’s portfolio consisted of just one bond, a laddered portfolio reinvests to maintain a set maturity exposure, so it may produce a roll-down return until the year before the last bond initially purchased is set to mature — that is, nine years for the 1-10 year ladder in this hypothetical example.
We froze interest rates in our example for illustrative purposes. But in the real world, interest rates move. Typically, when the yield curve gets steeper, the benefits of the roll-down tend to increase. Predictably, the steepening we have experienced in 2021 has helped to increase the value of the roll-down.
According to the Eaton Vance Parametric Laddered Investing Interest Rate Scenario Tool, for a 1-10 year BBB-rated ladder (assuming no change in interest rates), the roll-down would add 0.56% to the total return of a muni ladder and 0.97% to the total return of a corporate ladder. Based on our historical experience, a rising rate scenario has generally resulted in higher total returns over time.