
The most recent release of the University of Michigan’s consumer sentiment survey data saw the headline number dip slightly, comprised of an increase in the Current component to the highest since October 2021 offset by a marginal decline in the Expected component. Nonetheless, the headline number remains in an upward trend, having bottomed in June last year. The strength of the number is sometimes cited as a reason to be optimistic about the outlook for consumption and, by association, US equities. However, what do the statistics tell us about the relationships between consumer sentiment survey data, equity market performance and measures of personal consumption? Daniel Murray explores these relationships in this Macro Flash Note.
A common line of reasoning asserts that strength in consumer sentiment data is a good indicator of strong future consumption trends. This is often interpreted positively by markets because of its implications for broad economic growth and, hence, corporate profits. The most recent consumer sentiment data released on 11 August came in at 71.2, a marginal decline of 0.4 from the previous month but significantly higher than the 2022 lows.
Chart 1. University of Michigan Consumer Sentiment Index
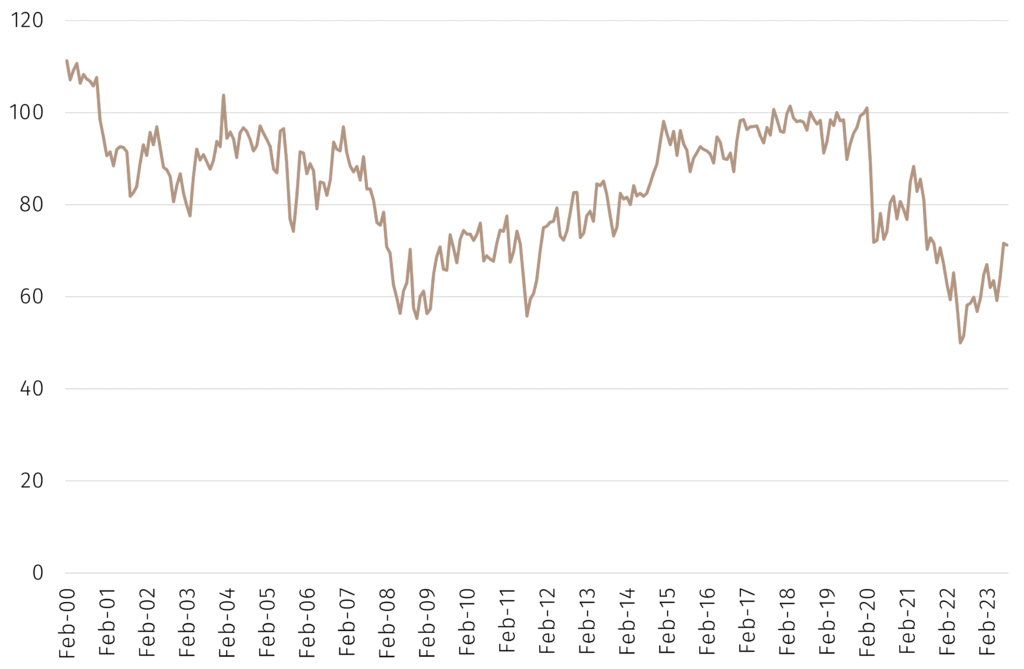
Source: Bloomberg, EFGAM calculations. Data as of 11 August 2023.
There are a number of ways to explore the implications of this for consumption and for markets. Here a simple approach is used in which the coincident, leading and lagging correlations are calculated.
The University of Michigan provides a composite indicator of consumer sentiment as well as separate indicators for current and expected conditions. There are different measures one could use to explore relationships with household spending. In this analysis we use three measures of advance retail sales (headline, ex autos and ex autos and gas) all of which are nominal i.e. not adjusted for inflation, and two measures of personal consumption expenditures (one nominal and one real). The real measure is used as a check to ensure that the relationships do not change once an inflation adjustment is included. The S&P 500 index of large cap US equities is also used. In all instances month-on-month percent changes in the data have been used to calculate the correlation coefficients. The analysis uses data from January 2001 to June 2023 (282 observations).
Table 1 below summarises the results.
Table 1. Correlations with the University of Michigan Consumer Sentiment Index
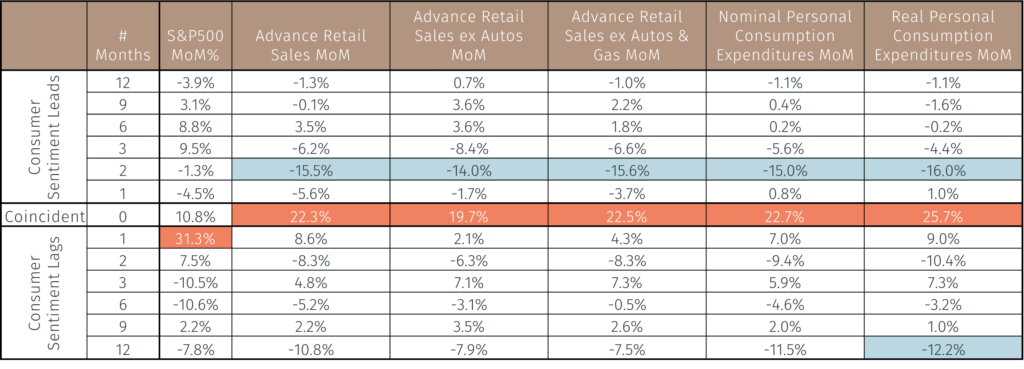
Source: Bloomberg, EFGAM calculations. Data as of 11 August 2023.
For brevity, the table includes results for each of the first three leading and lagging months and then for months 6, 9 and 12. The correlation coefficients for the intermediate months are not meaningfully different to those at the end of months 6, 9 and 12. The table includes coefficients only for the aggregate Consumer Sentiment index; similar tables for Current and Expected Sentiment are included in the Appendix. The highest value correlations are highlighted in orange and are all statistically significant at the 5% level. The cells highlighted in blue are also statistically significant at the 5% level.
The table illustrates a number of interesting points:
- None of the correlations are particularly high, the peak being 31.3%.
- The strongest correlation is between current monthly changes in the Consumer Sentiment index and the previous monthly change in the S&P 500 index i.e. if the stock market delivered strong (weak) returns last month, the Consumer Sentiment index increased (decreased) this month.
- Peak correlations between Consumer Sentiment and the various measures of retail sales and personal consumption are weak and coincident i.e. they occur at the same time.
Similar messages pertain to the tables that use Current and Expected Sentiment. A notable difference for Expected Sentiment is that the largest absolute correlations occur when Expected Sentiment leads retail sales or consumption by two months. However, the absolute values of the correlations are less than 15% in all cases. Moreover, they are negative, indicating that an increase in Expected Sentiment has on average resulted in a decline in those measures of retails sales and consumption. For Current Sentiment it is interesting to note that some small but statistically significant correlations are negative; when the stock market goes up, Current Sentiment declines.
The overall messaging then is that consumer sentiment is a poor leading indicator of either markets or activity but, inasmuch as there is a relationship, it is likely from markets to sentiment not the other way round. One way to interpret this finding is that a robust macro environment benefits many parts of the economy including equity markets and this then encourages people to feel more optimistic. Whether one believe this narrative or not, the analysis demonstrates how dangerous it is to overly-interpret the data and draw appealing conclusions that are unsupported by statistical evidence.
Appendix
Table A1. Correlations with the University of Michigan Current Sentiment Index
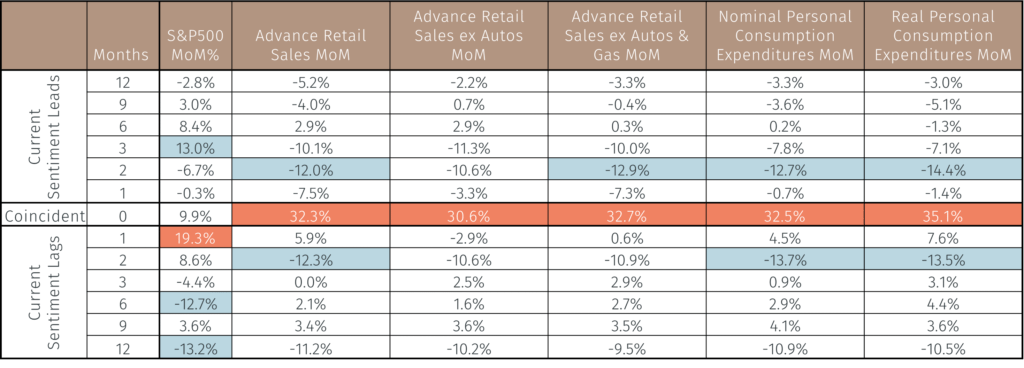
Source: Bloomberg, EFGAM calculations. Data as of 11 August 2023.
Table A2. Correlations with the University of Michigan Expected Sentiment Index
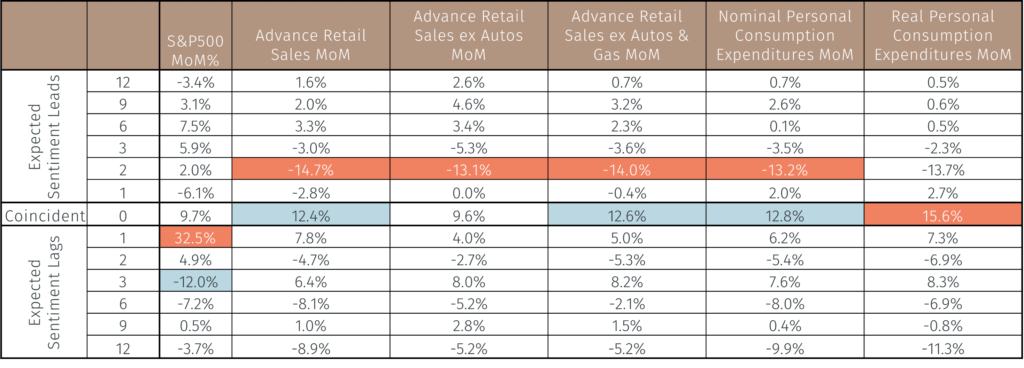
Source: Bloomberg, EFGAM calculations. Data as of 11 August 2023.
The highest value correlations are highlighted in orange and are all statistically significant at the 5% level. The cells highlighted in blue are also statistically significant at the 5% level.