
Allocating to emerging markets (EM) has been a tall task recently. Looking at the trailing five-, 10- and 15-year periods, the broad MSCI Emerging Markets Index (MSCI EM) lagged the S&P 500 by more than 11%, 10% and 9% annually, respectively1. However, flows to EM from non-EM investors have started to pick up in June. With $22 billion net2 ($12.3 in stocks and $9.8 in debt securities), June has been the best month since January.
There have been pockets of companies within emerging markets that have experienced solid performance over these periods – usually driven by idiosyncratic considerations such as country, sector and factor exposures. As seen in the chart below, Value and Growth companies in emerging markets have had periods of outperformance over the past 5 years.
Figure 1: Historical performance of the MSCI Emerging Markets compared to the S&P 500
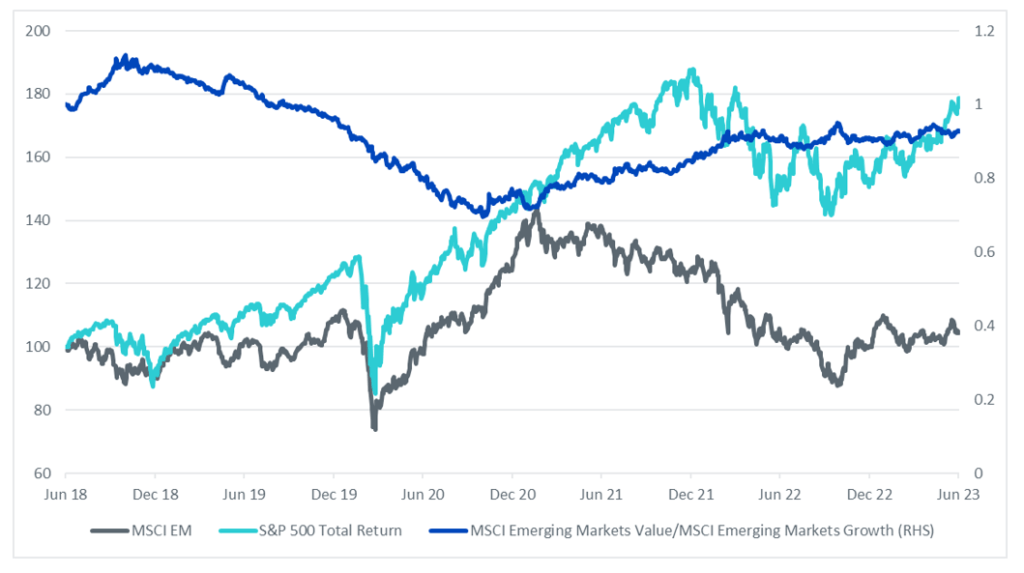
Source: WisdomTree, Bloomberg. Data from 29 June 2018 to 30 June 2023. Historical performance is not an indication of future performance and any investments may go down in value.
At WisdomTree, we believe in the long-term benefits of diversification and encourage investors to allocate across regions and asset classes.
Below, we lay out a capital efficient way to allocate to Emerging Markets using WisdomTree’s strategies.
WisdomTree large cap emerging market strategies
WisdomTree has two strategies that provide exposure to emerging market3 companies: the WisdomTree Emerging Markets ex-State-Owned Enterprises ESG Screened strategy and the WisdomTree Emerging Markets Equity Income UCITS strategy.
The Equity Income strategy was launched in 20074 and provides exposure to the highest dividend-yielding companies in emerging markets. The strategy reconstitutes annually and holds the highest (top 30%) dividend-yielding companies in EM, screening out those with the highest risk according to our Composite Risk Screen measure. Following the most recent rebalance, it is overweight Energy, Materials and Financials and underweight Consumer and Health Care sectors compared to the MSCI EM. It is also overweight Brazil and Taiwan and underweight China, India and South Korea with respect to MSCI EM.
The ex-State-Owned strategy was launched in August 20144 and its investment thesis is to identify State-Owned companies (SOE’s) – defined as those with 20% or more local government ownership – and exclude them from the investable universe. The strategy, which also reconstitutes annually, weights non-State-Owned Enterprises using their market capitalisation and aims to maintain country neutrality and sectors within +/- 3% of the starting universe prior to removing SOE’s. This results in a consistent overweight to Consumer Staples and Discretionary, Information Technology, and Health Care and underweights to Energy, Financials and Utilities.
By looking at each portfolio’s fundamentals, one can see how these indices provide different factor exposures to investors. The ex-State-Owned strategy tends to have high profitability metrics (ROE, ROA) and growth estimates resulting in exposure to Quality and Growth factors. Meanwhile, the Equity Income strategy has a Value and Quality tilt with a high dividend yield, lower valuations and strong profitability metrics.
Figure 2: Aggregate Fundamentals (as of 30/06/2023)
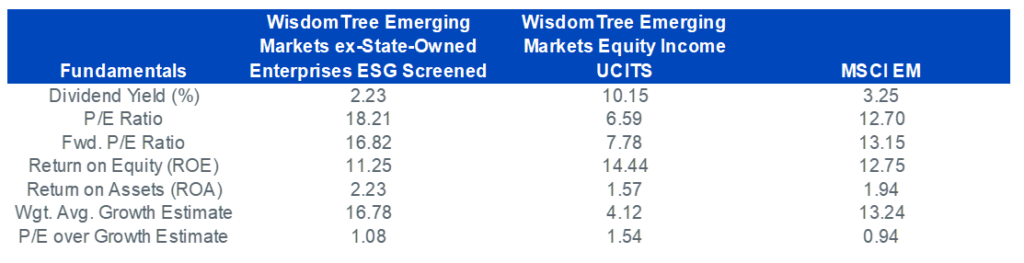
Source: WisdomTree, FactSet. Data as of 30/06/2023. Historical performance is not an indication of future performance and any investments may go down in value.
Since their common inception almost 9 years ago, both strategies have each outperformed the MSCI EM by more than 80 bps annualised, almost doubling its risk-adjusted return.
We can see below how both indices achieved this with a different risk-return profile and driven by their underlying factor exposures.
The ex-State-Owned strategy outperformed during the years where Growth companies in EM outperformed and experienced its maximum drawdown when Value companies led as commodity prices rebounded in 2021 and 2022. The Equity Income strategy experienced its highest drawdown at the start of the period only to track closer to MSCI EM in the subsequent years and experience its stronger period of relative performance in the past 18 months, as dividend payers have outperformed.
Figure 3: Performance metrics (29/08/14 – 30/06/2023)
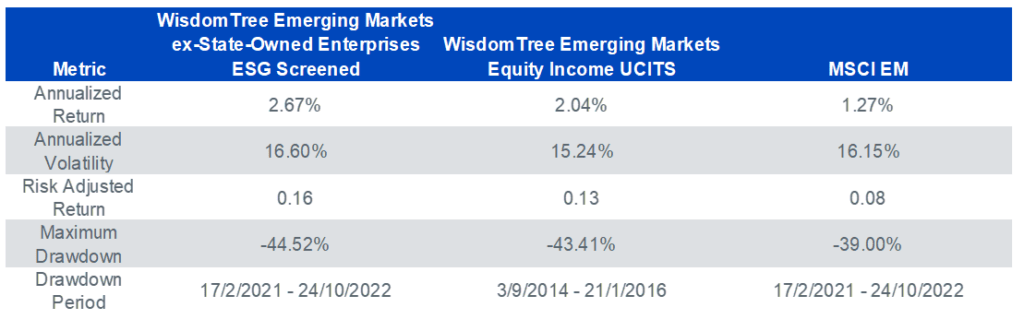
Source: WisdomTree, FactSet. Data from 29/08/2014 – 30/06/2023. Historical performance is not an indication of future performance and any investments may go down in value.
Figure 4: Performance of WisdomTree EM strategies compared to the MSCI EM
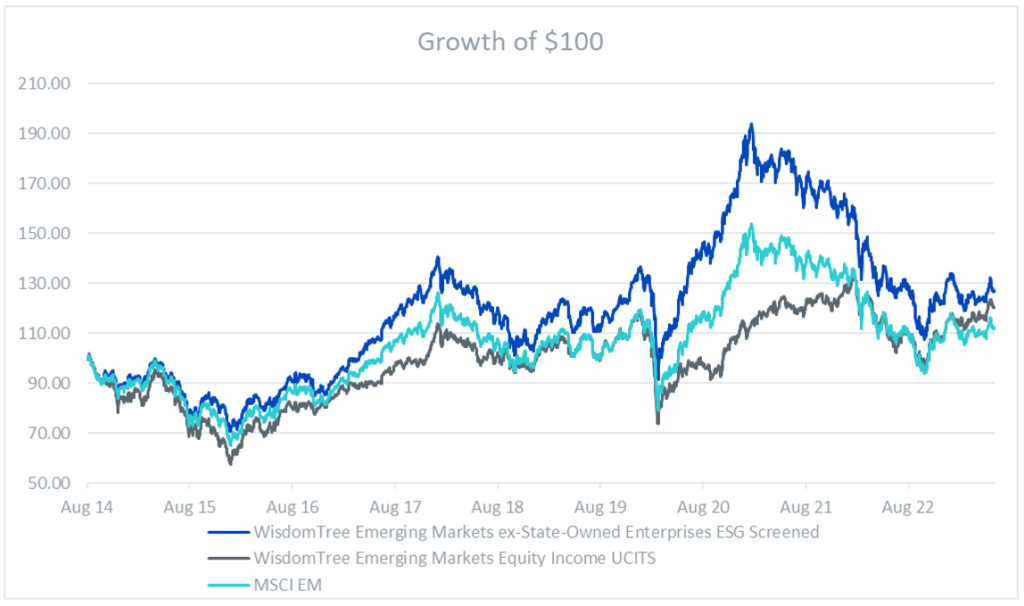
Source: WisdomTree, FactSet. Data from 29/08/2014 – 30/06/2023. Historical performance is not an indication of future performance and any investments may go down in value.
The power of diversification
It can be difficult to make an investment decision looking at the information presented above and without knowledge of how markets (and investment factors) will behave in the future.
Modern Portfolio Theory (MPT) – first introduced by Nobel Prize winner Harry Markowitz in 1952 – states that a portfolio’s idiosyncratic risk can be reduced by investing in assets which are not perfectly correlated. Applying this theory to WisdomTree’s two EM indexes, the portfolio’s idiosyncratic risk is driven mainly by the Sector, Country and Factor exposures resulting from the index’s methodology. The chart below shows the rolling 12-month correlation between our 2 strategies.
Figure 5: Rolling correlation: WisdomTree Emerging Markets ex-State-Owned Enterprises ESG Screened versus WisdomTree Emerging Markets Equity Income UCITS
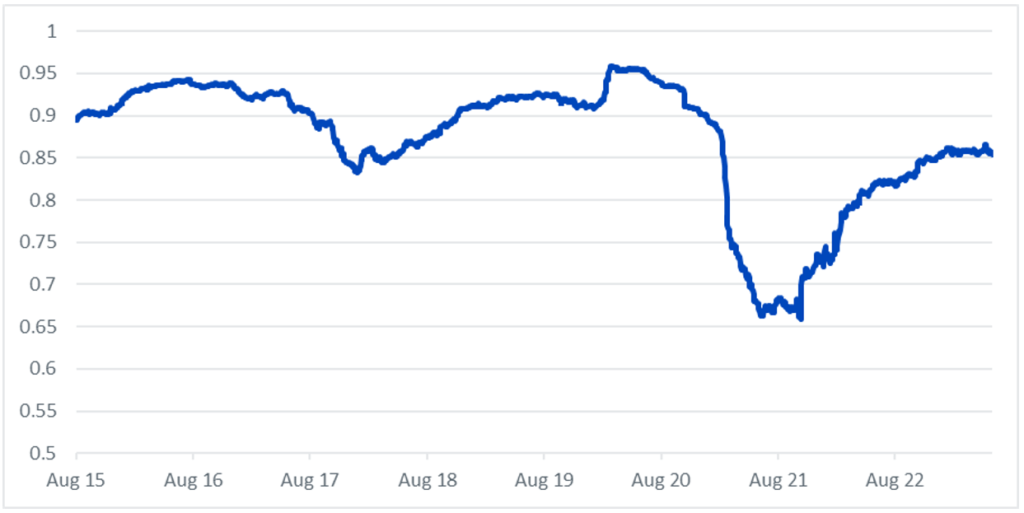
Source: WisdomTree, FactSet. Data from 29/08/2014 – 30/06/2023. Historical performance is not an indication of future performance and any investments may go down in value.
The lower correlation between these indices could potentially allow investors to build a more efficient EM asset allocation. The efficient frontier below, shows the annualised return and volatility of portfolios built by combining the 2 strategies. The data used for this chart stems from 29/08/2014 to 30/06/2023 and assumes that the allocation is rebalanced quarterly at the end of February, May, August, and November. Each dot on the curve shows a 5% shift in allocation from one asset to the other.
Figure 6: Asset allocation: WisdomTree Emerging Markets ex-State-Owned Enterprises ESG Screened versus WisdomTree Emerging Markets Equity Income UCITS
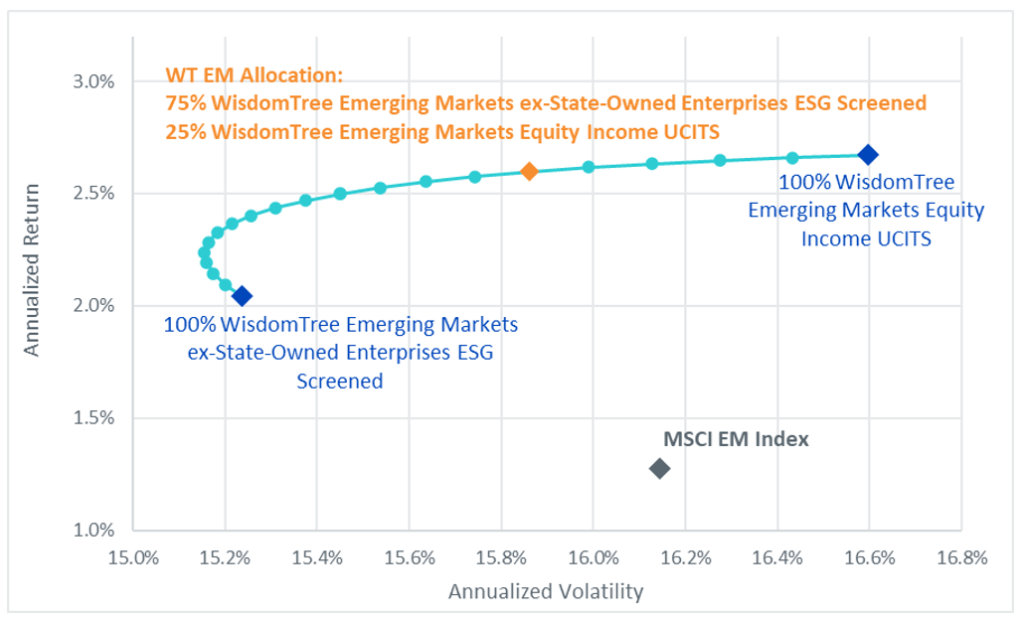
Source: WisdomTree, FactSet. Data from 29/8/2014 – 30/6/2023. Historical performance is not an indication of future performance and any investments may go down in value.
As we can see, the combination of both strategies over the period, would’ve allowed investors to obtain comparable levels of return while reducing volatility. It is also interesting to see how most points on the curve have higher returns than the MSCI EM with lower volatility. The highlighted allocation (WT EM Allocation), which holds 75% in the WisdomTree Emerging Markets ex-State-Owned Enterprises ESG Screened strategy and 25% in the WisdomTree Emerging Markets Equity Income UCITS strategy, represents the point in the curve with greatest risk-adjusted returns. If we look at the performance metrics in the table below, we can see the power of diversification as the WT EM Allocation portfolio has increased risk-adjusted returns and lower drawdowns than each individual strategy in isolation.
Figure 7: Performance metrics (29/08/2014 – 30/06/2023)
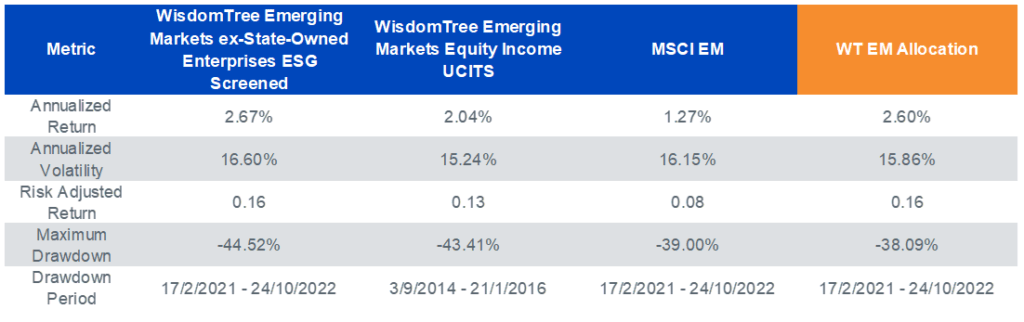
Source: WisdomTree, FactSet. Data from 29/08/2014 – 30/06/2023. Historical performance is not an indication of future performance and any investments may go down in value.
Figure 8: Aggregate Fundamentals (as of 30/06/2023)
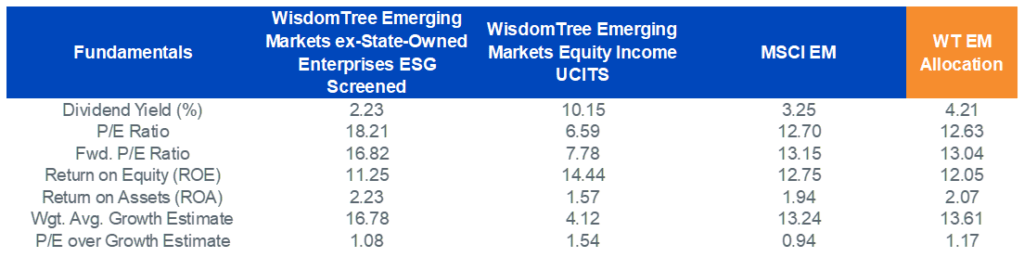
Source: WisdomTree, FactSet. Data from 29/08/2014 – 30/06/2023. Historical performance is not an indication of future performance and any investments may go down in value.
The resulting fundamentals are also considered attractive compared to the broad MSCI EM in terms of valuations, dividend yield and profitability. We therefore believe a combination of the WisdomTree Emerging Markets ex-State-Owned Enterprises ESG Screened UCITS ETF (XSOE LN) and WisdomTree Emerging Markets Equity Income UCITS ETF (DEM LN), which track both strategies respectively, can be a good way to gain exposure to emerging markets in an investor’s portfolio.
Sources
1 Source: FactSet. Data from 30/06/2008 – 30/06/2023.
2 Source IIF. 13 July 2023.
3 WisdomTree includes companies incorporated and listed in the following countries Brazil, Chile, China, Czech Republic, Hungary, India, Indonesia, Korea, Malaysia, Mexico, Peru, Philippines, Poland, Russia, Saudi Arabia, South Africa, Taiwan, Thailand or Turkey.
4 ESG exclusion filters were added to the strategy in October 2020.