

Despite their forgettable performance in 2022, we think small-cap stocks are worth another look.
Key Takeaways
U.S. small-cap stocks lost more than a fifth of their value in 2022.
Historically, the asset class has rebounded quickly from sharp declines.
We believe strong balance sheets and current low valuations make small caps attractive.
2022 Was Tough for Small Caps
With high inflation, rising interest rates and geopolitical tension, 2022 proved a nightmare for most asset classes, ranging from consumer stocks to high-yield bonds. U.S. small-cap stocks didn’t escape the pain, losing a fifth of their value.¹
Yet the scope of that decline, combined with current valuation and balance sheet metrics, offer key reasons we think small-cap equities appear attractive as we look ahead.
The small-cap universe, generally regarded as the equity market’s least efficient space, tends to offer active managers opportunities to outperform. Moreover, given the market’s tendency to punish low- and high-quality companies alike during severe downturns, the asset class may offer substantial near-term return potential.
Will Small Caps Bounce Back?
History suggests that small-cap stocks don’t stay down long after they plunge. Heading into last year, small caps had posted calendar-year losses 12 times since 1980. After those 12 losses, small caps delivered positive results the following year 11 times with average gains of 22%. Moreover, in the four years following double-digit losses – such as last year’s – the index surged an average of 37%.²
Certainly, recession worries abound as the Federal Reserve continues its inflation fight. Concerns were especially heightened after U.S. real gross domestic product declined in the first two quarters of 2022 before rebounding in the second half of the year. Though the recession watch continues, we think it’s possible investors may already have “priced in” a significant contraction, given that small caps plunged 28% between their November 2021 peak and the end of 2022.
If a recession does occur, small-cap investors ultimately could benefit. In the 16 U.S. recessions in the past century, small-cap stocks have increased an average of 39% in the next 12 months, almost double the average 22% gain of large-cap stocks.³
Small Cap Fundamentals Are Strong
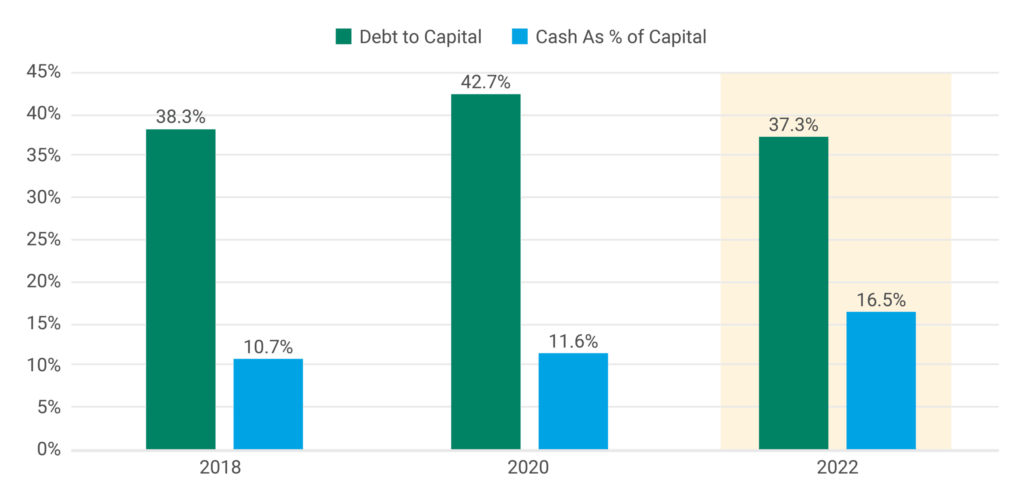
We think small caps appear attractive purely from a fundamental standpoint. For example, when we look at balance sheet strength, we see that the debt-to-capital ratio of U.S. small-cap companies is lower than in recent years. In addition, aggregate cash as a percentage of their overall capital is higher. See Figure 1.
Figure 1 | Balance Sheets Are in Better Shape Than They Were Before the Pandemic
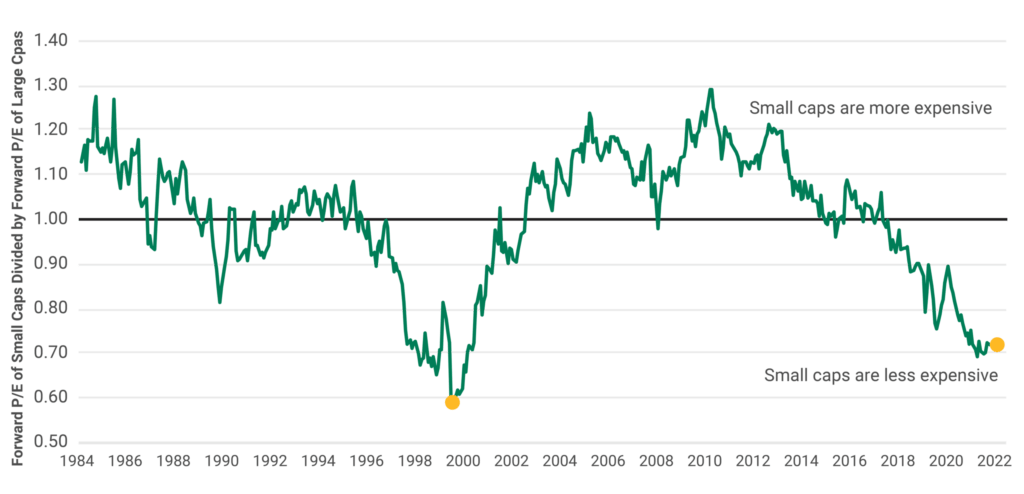
Finally, small-cap stocks appear to be cheaper compared to their historical averages and larger stocks. For one, they’re trading near their widest valuation discount to large-cap stocks in 23 years. See Figure 2. In addition, their price-to-projected earnings ratio for the next 12 months has fallen 25% below their long-term average.⁴
Figure 2 | Compared to Large Caps, Small Caps Are Nearly as Cheap as They Were in 2000
We believe these are attractive valuations — especially for an asset class that has produced three times the cumulative investment return of large-cap stocks since 1926.⁵ Despite 2022’s forgettable performance, we think investors should not shy away from their strategic allocation to small caps in their diversified portfolios.
1Source: FactSet.
2Russell Investments. Small capitalization stock performance is based on the Russell 2000® Index.
3Source: Center for Research in Security Prices (CRSP), The University of Chicago Booth School; Jefferies. Large cap represented by S&P 500 Index. Mid caps represented by CRSP 3-5 decile index from 1926 to 2011; CRSP mid cap index from 2012 to present. Small caps represented by CRSP 6-8 decile index from 1926 to 2011; CRSP Small Cap index from 2012 to present.
4Data as of 12/31/2022. Source: FactSet.
5Source: FactSet.
The opinions expressed are those of American Century Investments (or the portfolio manager) and are no guarantee of the future performance of any American Century Investments’ portfolio. This material has been prepared for educational purposes only. It is not intended to provide, and should not be relied upon for, investment, accounting, legal or tax advice.
This material has been prepared for educational purposes only. It is not intended to provide, and should not be relied upon for, investment, accounting, legal or tax advice.
No offer of any security is made hereby. This material is provided for informational purposes only and does not constitute a recommendation of any investment strategy or product described herein. This material is directed to professional/institutional clients only and should not be relied upon by retail investors or the public. The content of this document has not been reviewed by any regulatory authority.
Diversification does not assure a profit nor does it protect against loss of principal.