
In this, our eighth annual Impact @ Impax report, we again look to quantify the environmental benefits delivered by the companies in our investment portfolios.
At Impax, the investment strategies we manage are designed to intentionally allocate clients’ capital towards those companies we expect to benefit as the global economy transitions to a more sustainable model. This impact report shows how this intention has been translated into action.
The journey to net zero
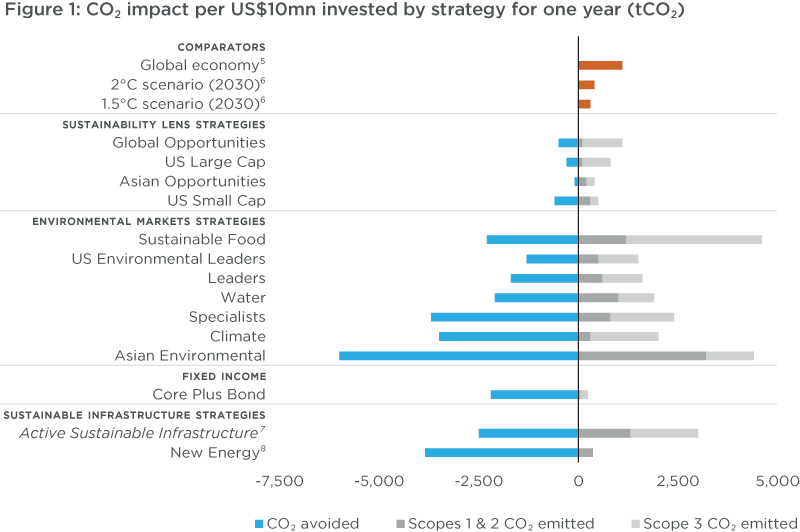
Measuring the net CO2 impact of the companies within Impax portfolios helps us to demonstrate their contribution to the transition to a lower carbon economy. As in previous years, we summarise the CO2 impact per US$10 million (mn) invested in Impax strategies for one year. This captures CO2 emission and avoidance reporting for approximately 90% of Impax’s assets under management, as of 31 December 2021.
Building on our reporting in 2021, we separate strategy emissions out into Scope 1 and 2 – which includes direct and indirect emissions from energy produced and consumed by portfolio companies – and Scope 3 – which includes indirect emissions from portfolio companies’ supply chains and products in use.
We believe comparison with real-world comparators helps to providing context and challenge. As well as a ‘global economy’ greenhouse gas intensity figure, which represents estimated emissions from US$10mn of investment in the today’s global economy overall, we also estimate the GHG emissions intensity of the global economy under scenarios compatible with limiting temperature rise to 1.5°C and 2°C, respectively. These comparisons demonstrate the challenge ahead.
Innovation in impact reporting
We continue to develop our impact reporting approach through our own research and in response to what our stakeholders tell us. For each investment strategy, we consider its specific investment objectives when identifying the most relevant impact metrics to measure and report on.
Our reporting expands again this year to include another of our Environmental Markets strategies, US Environmental Leaders, which was launched in 2019. We also include indicative impact reporting for our Active Sustainable Infrastructure strategy based on model portfolio holdings, in advance of its launch in Autumn 2022.
For the first time, we have also extended our reporting beyond equities and private markets strategies and this year also report on one of Impax fixed income portfolios, Core Plus Bond. In another first, this goes beyond environmental impact metrics to capture metrics for social impact.
Alignment with the UN SDGs
The UN Sustainable Development Goals (SDGs) comprise a series of 17 sets of targets across a range of issues to be met by the world’s economies by 2030. As in 2021, we have mapped Impax’s strategies to the SDGs to indicate their level of alignment with this framework. We do so by identifying the proportion of portfolio companies’ revenues related to activities described by the targets within each Goal.
Impax’s investment process does not analyse alignment with SDGs as an investment objective or component of portfolio construction. Instead, we use the SDG framework to understand which current portfolio companies are involved in activities that contribute towards addressing these critical global challenges. The nature of Impax’s investment philosophy results in some meaningful exposure to the SDGs as a by-product of the investment process.
Important information
These figures refer to the past. Past performance is not a reliable indicator of future results. Impax impact calculations are based on strategy AUM and portfolio holdings as at 31 December 2021. Please refer to our Methodology (page 28 of the report) for details.
5Source: Impax calculations based on estimated global assets under management in 2020 (Source: Financial Stability Board. 2021: Global Monitoring Report on Non-Bank Financial Intermediation 2021) and estimated global GHG emissions in 2018 (Sources: Our World in Data, 2020: CO₂ and Greenhouse Gas Emissions, & Emissions Database for Global Atmospheric Research, 2021: GHG emissions of all world countries). The GHG emissions figure used is an average of both sources, adjusted to an estimated 2021 figure using the average growth rate in CO₂ emissions from energy combustion and industrial processes between 2018 and 2021 (Source: IEA, 2022). The emissions intensity figure is derived by dividing the adjusted global GHG emissions figure by the global AUM figure.
6Source: Impax calculations based on estimated global assets under management (AUM) in 2030 and estimated global GHG emissions in 2030 compatible with the 1.5°C and 2°C alignment scenarios. The 2030 global AUM figure is calculated by extrapolating the 2020 global AUM figure (Source: Financial Stability Board (FSB), 2021: Global Monitoring Report on Non-Bank Financial Intermediation 2021) using the compound annual growth rate in global AUM between 2002 and 2020 (Source: FSB). The 1.5°C-aligned and 2°C-aligned global GHG emissions figures are calculated by reducing 2010 global emissions (an average of two sources: Our World in Data, 2020: CO₂ and Greenhouse Gas Emissions, & Emissions Database for Global Atmospheric Research, 2021: GHG emissions of all world countries) by 45% (1.5°C) and 25% (2°C) respectively. The 45% and 25% reduction needed by 2030 are internationally accepted figures (IPCC, 2018: Global Warming of 1.5°C Summary for Policymakers). The emissions intensity figure is derived by dividing the estimated global GHG emissions figure by the estimated global AUM figure.
7Reporting for the Active Sustainable Infrastructure strategy is based on model portfolio holdings, in advance of its launch in Autumn 2022. Data represents indicative underlying holdings of proposed strategy. Actual holdings and therefore impact data may vary and should not be relied upon.
8Reporting for the New Energy considers the lifecycle emissions of its investments which covers Scope 1, 2 and 3 emissions. The source for solar and wind emissions factors is Annex II: Metrics & Methodology, in “Climate Change 2014: Mitigation of Climate Change. Contribution of Working Group III to the Fifth Assessment Report of the Intergovernmental Panel on Climate Change”. For hydropower, we use hydroelectric emissions factors published by the Norwegian Water Resources and Energy Directorate (NVE).