
Uncertainty has been growing over Beijing’s willingness to support State-Owned Enterprises (SOEs) evident from a series of defaults by SOEs since the second half of 2020. A confluence of reasons has led to a sharp increase in default rates of companies in both onshore and offshore Chinese markets –tighter monetary policy, stricter lending policy by onshore banks coupled with the Chinese government’s increasing tolerance towards SOEs defaulting on their debt obligations. This has led investors to revaluate their assumption of an implicit trust of government guarantee behind most SOEs. During the period between 2017 and 2019, non-SOEs accounted for 80% of the defaults. However last year the SOE defaults rose sharply, and we have witnessed a similar trend in the first quarter this year.
Figure 1: The share of SOEs in China’s onshore bond defaults rose sharply in 2020
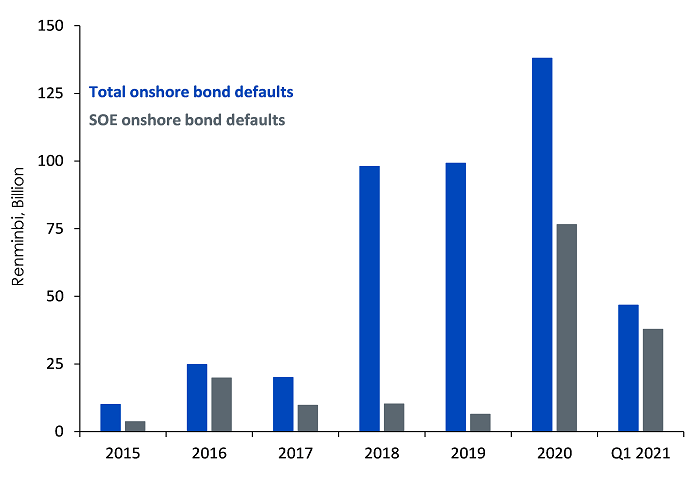
Source: Bloomberg, WisdomTree as of 30 June 2021
SOEs defaults broaden beyond the traditional sectors
Not only has the share of SOEs risen but we have also observed a shift in the composition of onshore defaults from a sector perspective since 2018. Over the last three years, many companies facing financial stress belonged to industries affected by overcapacity such as – energy, utilities, industrials, and materials. However last year saw a sharp change in trend, during which 40% of defaults by outstanding amount were from the technology sector (half of which could be attributed to one subsidiary of a top Chinese university). While three quarters of offshore dollar bond defaults in 2018 were also in the energy sector. In 2020, we witnessed a sharp reversal in trend with nearly 70% of such defaults stemming from the financial and technology sector. In Q1 2021, the number of new defaults has been low, but with larger amounts outstanding compared to prior years.
Figure 2: Sector breakdown of onshore defaults by outstanding amount in 2018 versus 2020
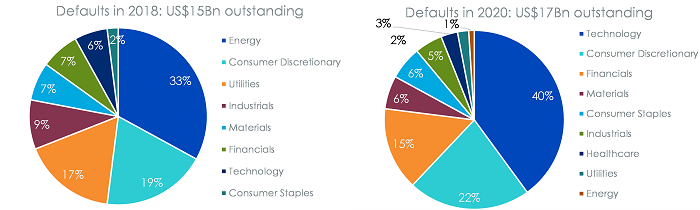
Source: Bloomberg, WisdomTree as of 30 April 2021
We believe China’s acknowledgment of the insolvency of these debt-ridden firms will ultimately benefit its own economy. For one, the continuation of SOE defaults lowers the unfair advantage that SOEs have enjoyed over non-SOEs, paving the way for a more efficient allocation of financial resources over the long term. It will also improve the markets price discovery mechanism as investors respond to these changing risks.
Harnessing the structural advantage of non-SOEs over SOEs within EM
One of the big differences between developed and emerging market stocks lies in their ownership structure. The largest share of Emerging Market (EMs) companies are SOEs, in which a government entity has significant (more than 20%) ownership control. China has one of the highest proportions of state ownership within EMs. Notably, the rise in default rates of SOEs within China has certainly played a role in turning investors’ attention to non-SOEs. We have held the view for a while now, that non-SOEs have displayed a structural advantage versus SOEs in terms of typically higher performance, higher quality and lower leverage1. Owing to the lower degree of state ownership, non-SOEs also have an inherent tilt towards ESG via better corporate governance and environmental considerations. The WisdomTree EM ex-SOE Environmental, Social, and Governance (ESG) screened Index enables investors to capitalise on the potential long-term growth opportunity of EMs whilst limiting exposure to SOEs. It aims to deliver two important factors such as long-term growth and quality as it screens for companies with significant government ownership. This is evident in the table below from the relatively higher return on assets (ROA)2 and ROE3 compared to its peers.
Figure 3: Fundamentals Comparison
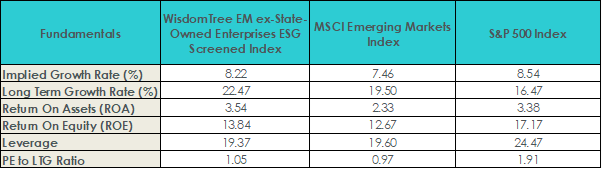
Source: Bloomberg, Factset, WisdomTree as of 31 July 2021
Historical performance is not an indication of future performance and any investments may go down in value.
Sources
1 From 30 December 2007 to 30 June 2021, SOEs represents a broad-based market capitalisation weighted portfolio of companies that have more than 20% ownership by a government entity.
2 Return on Assets (ROA): Firm profits (after accounting for all expenses) divided by the firm’s total assets. Higher numbers indicate greater profits relative to the level of assets utilized to generate them.
3 Return on Equity (ROE): Measures a corporation’s profitability by revealing how much profit a company generates with the money shareholders have invested.
Related blogs
+ Emerging markets – in need of a jab
Related products
+ WisdomTree Emerging Markets ex-State-Owned Enterprises ESG Screened UCITS ETF – Acc (XSOE)