
Since we last discussed the odds of a recession here, the prospect of a recession has become consensus. The issue that remains under scrutiny is the duration and intensity of the recession. The slide in stock markets has destroyed nearly US$35trn of global wealth in H1 2022. In terms of timing, the European economy is headed for a recession by year-end, while the US economy could enter a recession by the end of Q1 2023. A mild recession is expected in the US, whilst in Europe, the intensity of the recession will depend on how the energy crisis is managed.
US – Fading the Federal Reserve (Fed)
The US economy is showing signs of growth slowing and inflation peaking. While Gross Domestic Product (GDP) dropped for two consecutive quarters, Gross Domestic Income (GDI) rose in Q1, and real personal income ex-transfer payments increased in Q2. This increases the likelihood of a stronger GDI print in Q2. More importantly, history has shown that the gap between GDP and GDI tends to be closed, with GDP being revised closer to GDI.
The labour market remains strong as jobs continue to be added, wages accelerate, and unemployment remains at a five-decade low. The decline in headline Consuer Price Index (CPI) inflation from 9.1% to 8.5% was a welcome relief to markets. The Federal Reserve path has repriced notabley since the release of the CPI report, with the terminal rate down to 3.55% from 4.25%. While inflation data cooled across non-core and core components, cyclical components like shelter remain elevated. This CPI print validates the case for a 50 basis points (bps) rate hike in September and further moderation going forward (lower than 75bps rate hikes going forward).
US Q2 earnings reports have surprised on the upside, with consensus earnings expectations for the year to the June quarter rising from 5% a month back to 8.77%. It is well documented that yield curve inversions always lead to a recession. Interestingly market performance following the inversion has generally been positive. Since the most recent yield curve inversion in June, equities have rebounded similar to scenarios witnessed in the past.
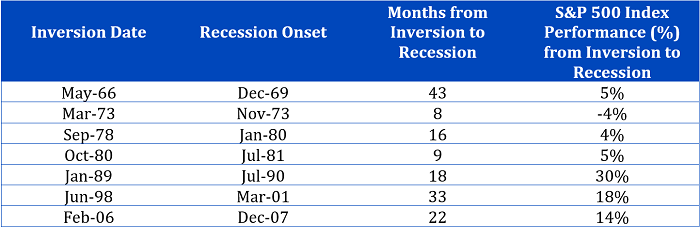
Source: Federal Reserve Bank of St Louis, NBER as of 30 June 2022
Europe’s recession will go hand in hand with higher energy prices
Europe’s economy continues to face headwinds from the ongoing energy crisis. Inflation and growth risks have increased further. The Eurozone economy avoided a technical recession in Q2 as GDP rose more than expected by 0.7% Quarter on Quarter (QoQ). However, the growth outlook remains bleak amidst the energy crunch.
Russia has weaponised energy and food supply owing to Europe’s deep dependency. The Euro area is contending with an energy-shock and inflation far greater than in the US. With energy prices, up 42% Year on Year (YoY) in June 2022, energy contributed to more than half of the 8.9% YoY inflation reading in July. Complicating matters further, the Rhine River a pillar of the German, Dutch and Swiss economies for centuries — is set to become virtually impassable at a key waypoint owing to extremely shallow water levels. This will likely halt shipments of energy products and other industrial commodities along one of Europe’s most important waterways1. A prolonged heatwave could create delays for winter energy supplies at a crucial time for Europe. In the near term, the European Central Bank (ECB) will likely focus more on current inflation than on recession risks. As a result, the ECB will front load rates by 50bps on the 8th of September, followed by 25bps moves on the 10th of October and 15th of December.
Growth risks in China imply further policy stimulus
China’s economy continues to disappoint in 2022. China’s Q2 real GDP growth decelerated sharply to 0.4% YoY from 4.8% in Q1, owing to the covid wave and lockdowns since March. While June activity showed signs of a broad-based improvement post lockdown, the growth headwinds have not gone away entirely. The property market turmoil continues to tarnish sentiment with new emerging risks ranging from mortgage payment strikes and declining home sales in July. Fortunately, more effective policy easing is still needed to underpin growth and support demand challenges.
Defensive but not too defensive
Markets like to stay one step ahead. They do not react to the news as much as they anticipate it. ‘Buy the rumour, sell the news’ is a famous idiom for a reason. In most cases, markets start to fall on the risk of an economic recession, not when the recession is all but guaranteed. This year is no exception, H1’s performance was painful for investors because the market anticipated that strong rate hikes would slow the economy even if it was still growing. Once the economy started to show signs of slowing, markets started to predict monetary easing and rebounded in July.
What does our core scenario, where recession is guaranteed, and the only remaining issue is its duration and intensity, mean for investors?
It means that
- in all likelihood, the time for very defensive positioning is gone. The recession is priced in, so going to cash or Min Volatility would have been a good idea months ago.
- it may be too early for cyclical, aggressive play. Markets have not yet priced in a deep or long recession. A strong, established rebound could still be months away.
This leaves investors with defensively-minded, all-weather options. Equity Investment can protect the portfolio if the market starts to expect a deeper recession or participate in the upside if it anticipates a more technical recession.
Figure 2 compares the performance of the different equity factors during periods of equity drawdowns. We also include in the analysis a strategy (WisdomTree Quality) combining Quality and High Dividend (focusing on Dividend growing, high-quality companies).
Without surprise, the most defensive factor is Min Volatility which reduced the drawdown in all eight periods. Just behind, Quality, WisdomTree Quality and High Dividend would have helped protect the portfolio in 7 out of 8 of the periods. The rest are more cyclical and would have, in most cases, underperformed the market and delivered deeper losses.
Figure 2: Outperformance vs MSCI World in periods of equity drawdowns
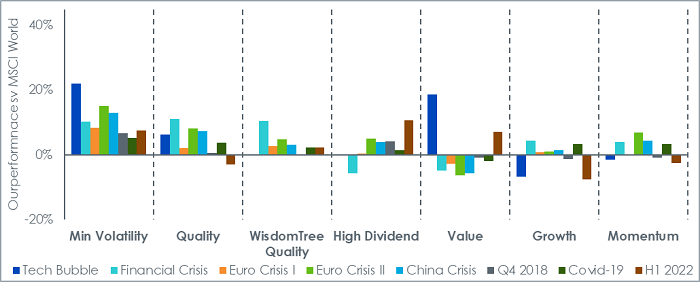
Source: WisdomTree, Bloomberg. In USD. Up to July 2022. The inception date for the WisdomTree Global Quality Dividend Growth Index is 16 October 2015. You cannot invest directly in an index. Above numbers include backtested data.
Historical performance is not an indication of future performance and any investments may go down in value.
See below for more details on the indices used in the figure.
Returning to defensively-minded, all-weather options, Figure 3 focuses on the most defensive factors but then looks at the capacity of those strategies to capture positive moves. The upside capture ratio is the percentage of market gain captured by a strategy when markets go up. If the upside capture ratio of a strategy is 60%, then when the market goes up by 10%, that strategy would only go up by 6%.
Clearly, Min Volatility suffers from a very low upside capture ratio. On the contrary, while being defensive (see Figure 2), Quality and High Dividend exhibit a large propensity to capture the market up moves. WisdomTree Quality is the strategy that exhibited the highest upside capture ratio.
Figure 3: Upside Capture Ratio of 5 equity strategies
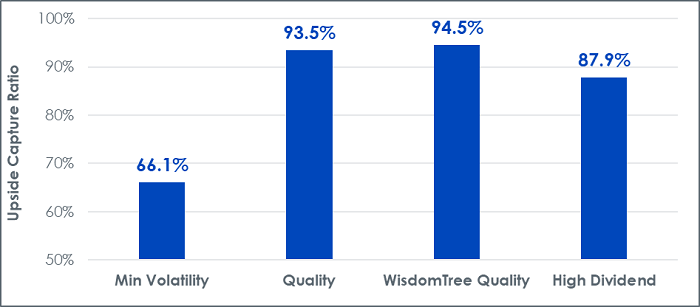
Source: WisdomTree, Bloomberg. Period September 2002 to July 2022. Calculations are based on monthly returns in USD. The inception date for the WisdomTree Global Quality Dividend Growth Index is 16 October 2015. You cannot invest directly in an index. Above numbers include backtested data.
Historical performance is not an indication of future performance and any investments may go down in value.
See below for more details on the indices used in the figure.
In the second half of 2022, awash with uncertainty, a balanced approach between high-quality and dividend-paying stocks could prove very useful in navigating the different ups and downs that could materialise.
Definitions
the Tech Bubble (4 September 2000 to 12 March 2003)
the Financial Crisis (16 July 2007 to 9 March 2009)
the Euro Crisis I (15 April 2010 to 5 July 2010)
the Euro Crisis II (2 May 2011 to 4 October 2011)
the China Crisis (15 April 2015 to 11 February 2016)
Q4 2018 (21 September 2018 to 27 December 2018)
Covid-19 (12 February 2020 to 23 March 2020)
H1 2022 (4 January 2022 to 17 June 2022)
Global equities are proxied by the MSCI World net TR Index.
Min Volatility is proxied by MSCI World Min Volatility net total return index. Quality is proxied by MSCI World Quality Sector Neutral net total return index. High Dividend is proxied by MSCI World High Dividend net total return index. Value is proxied by MSCI World Enhanced Value net total return index. Momentum is proxied by the MSCI World Momentum net total return index. Size is proxied by the MSCI World Small Cap net total return index. Growth is proxied by the MSCI World Growth net total return index. WisdomTree Quality is proxied by the WisdomTree Global Quality Dividend Growth net total return index.
Sources
1 German Federal Waterways and Shipping Administration