
“Riskier assets outperform less risky assets in the long run” is one of the first principles finance students have to learn. This principle is derived directly from the best-known finance model called the Capital Asset Pricing Model (CAPM) that links the return of an asset to the risk of that asset linearly. In this market efficient world, there is no free lunch. Returns and risk go hand in hand. Its driving equation (1) below offers an expected return for asset i (ERi) as a function of the risk-free interest rate (Rf) plus the systematic risk (beta) of asset i (βi) multiplied by the market risk premium (ERm − Rf).

Following this model, high beta (riskier) stocks are expected to have higher returns than low beta (less risky) stocks because they are riskier. Of course, we know, now, that the world is more complex than that and that the market is not perfectly efficient. Therefore reality plays out differently.
In reality, lower risk or lower beta stocks have historically outperformed higher beta stocks.
Looking at the US markets, for example (in Figure 1), we have separated all available stocks into five quintiles by beta. We observe that the highest beta stocks—the 20% of stocks with the highest beta—have lagged the market (10.09% on average per year vs 10.69% since 1963), and the lowest beta stocks—lowest 20%—have outperformed the market (10.72%).
Figure 1: Quintile Portfolios Sorted by Beta
Source: Kenneth French data library. Data is calculated at a monthly frequency and as of May 2021. The portfolios are rebalanced yearly at the end of June. The market represents the portfolio of all available publicly listed stocks in the US. All returns are in USD. Operating profitability for year t is annual revenues minus cost of goods sold, interest expense, and selling, general, and administrative expenses divided by book equity for the last fiscal year-end in t-1. You cannot invest directly in an index. Above numbers include backtested data.
Historical performance is not an indication of future performance, and any investments may go down in value.
Countless papers have been written to improve this model and explain the discrepancies between reality and efficient markets expectations. One of the most important of which is the Fama and French Three-Factor Model, an asset pricing model developed in 1992 that expands on the (CAPM) by adding size risk (SMB) and value risk (HML) factors to the market risk factor.

Fama-French argued that riskier stocks do indeed outperform less risky stocks but that market beta is not an all-encompassing variable for riskiness. The value risk (HML) or the Size risk (SMB) are also risks that need to be taken into account as they improve the statistical significance of the CAPM model in explaining returns (also called risk factors).
This model opened the door to factor investing as we know it. It consists of building a portfolio to focus on a given set of risks (or factors) that can deliver outperformance. In other words, instead of relying on increasing the beta of the portfolio as the only way to generate more returns, as in the CAPM, the objective here is to take more value risk or more size risk to generate more returns. Academics have continued to add new factors to their models, and Value, Size, Quality, Momentum, Low Volatility are the most widely recognised and academically backed among them.
The Quality Factor: What Is it and Why Does it Exist?
One academic factor that has gained a significant following in the investment community is Quality. It made its apparition, for example, in Fama French 5-factor model, published in April 2015, that extends on their previous models and include Quality (through profitability and low investment) as additional risk factors.
Figure 2 illustrates this Quality factor extremely well. While high-Quality companies—companies with high earnings, low debt, low variability in earnings—should be highly valued relative to low-Quality companies, resulting in lower expected returns, historical observations show the contrary. In fact, higher-Quality stocks, measured here by operating profitability, outperformed lower-Quality stocks by 400 bps annualised over the last 60 years.
On top of better performance, the stocks in the top quintile by Quality also exhibits a more interesting risk-return profile:
- Outperformance over the long term
- Reduced volatility versus the lower Quality stocks
- Improved Sharpe Ratio versus lower Quality stocks but also the market
- All weatherness, with a downside capture ratio of only 92% but an upside capture of virtually 100%.
- In other words, Quality stocks can behave defensively in downturns while capturing a large share of the upside in bull runs.
Figure 2: Quintile Portfolios Sorted by Operating Profitability
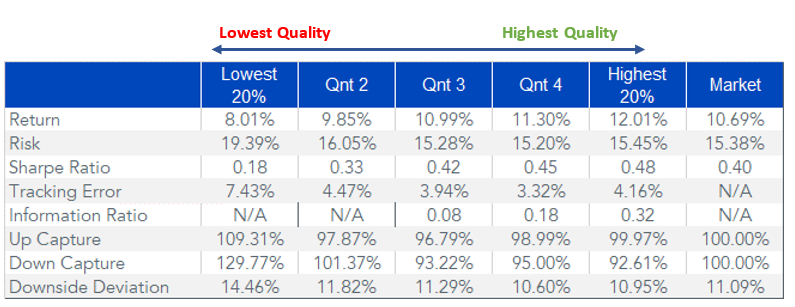
Source: Kenneth French data library. Data is calculated at a monthly frequency and as of May 2021. The portfolios are rebalanced yearly at the end of June. The market represents the portfolio of all available publicly listed stocks in the US. All returns are in USD. Operating profitability for year t is annual revenues minus cost of goods sold, interest expense, and selling, general, and administrative expenses divided by book equity for the last fiscal year end in t-1. You cannot invest directly in an index. Above numbers include backtested data.
Historical performance is not an indication of future performance and any investments may go down in value.
One theory explaining the anomaly is that these stocks may be riskier, but the risk is more difficult to observe using measures like standard deviation. For example, perhaps more of their value comes from distant earnings, making them more sensitive to fluctuations in interest rates and/or exposed to meeting lofty earnings growth expectations.
An alternative, more commonly accepted theory is that investors have an array of behavioural biases that cause them to be underweight in Quality stocks1. For example:
- Conservativism bias suggests investors are slow to update their opinions/forecasts based on new information, like strong or weak earnings
- Overconfidence bias could lead investors to over-weight their forecast of future earnings prospects over current profits
- Confirmation bias leads people to ignore new information that contradicts previous beliefs
In a market environment where certain “meme stocks” are trading without regard to fundamentals like earnings, perhaps we are seeing a real-time example of how behavioural biases can cause some investors to be under-exposed to Quality in their portfolios.
Defining Quality
The Quality factor is subject to greater differentiation in definition than factors like beta, value and size. Turning to our approach to Quality investing, we subscribe to the notion of profitability as a useful measure for defining Quality. We believe that it’s important to not dilute the potential power of Quality by applying too many stock selection rules or complex weighting schemes. In our view, the key is to be as broad-based and straightforward as possible while still focusing on companies with a high return on equity and low debt – attributes that are commonly considered to be fundamental in Quality investing.
Source
+ Thesmar, David & Bouchaud, Jean-Philippe & Stefano, Ciliberti & Landier, Augustin & Simon, Guillaume, 2016. “The Excess Returns of ‘Quality’ Stocks: A Behavioral Anomaly,” HEC Research Papers Series 1134, HEC Paris.