
Are high correlations the enemy of active investors? Or our friend?
FOR PROFESSIONAL INVESTORS AND/OR QUALIFIED INVESTORS AND/OR FINANCIAL INTERMEDIARIES ONLY. NOT FOR USE WITH OR BY PRIVATE INVESTORS. CAPITAL AT RISK. All financial investments involve taking risk which means investors may not get back the amount initially invested.
- Bubbles and bear markets lead to extreme valuations and high correlations in asset prices.
- Correlations in our areas of the market are currently near all-time highs; valuations are close to their all-time lows.
- High correlations are the enemy of stockpickers in the short term but our friend over the long term.
I’m a big fan of Michael Mauboussin. He’s a leading investment thinker and the various threads of his research are woven through our investment process. I recommend reading Expectations Investing and I particularly like his lecture on “the paradox of skill”. My favourite piece of his research, however, is a short paper with a long title:
Dispersion and Alpha Conversion: How Dispersion Creates the Opportunity to Express Skill
Dispersion of returns creates opportunities
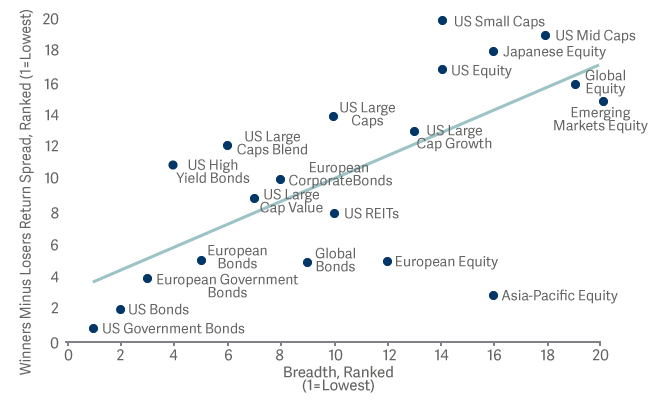
Research suggests that the higher the dispersion of returns within a particular asset class, the more likely it is that fund managers will be able to use their skill to differentiate themselves. This is one reason why we chose to focus our efforts on small-cap and mid-cap equities: it is the part of the global equity market where the dispersion of returns is the highest. (The other reason is that smaller companies have more impact).
Higher dispersion allows for enhanced expression of skill across asset classes
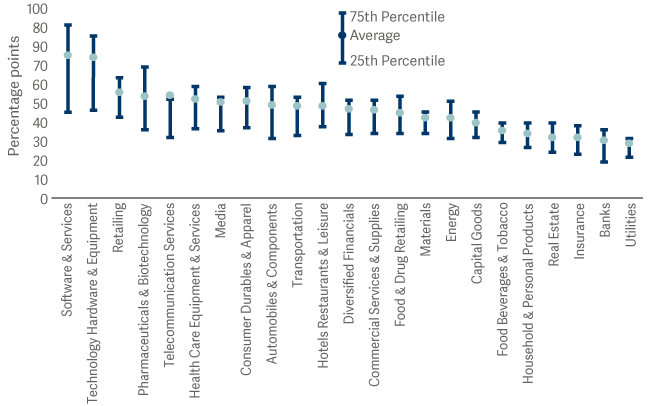
Within a given market, the level of dispersion varies by subsector. Returns in some parts of the market (such as utilities, banks and energy) are relatively homogenous because macro factors (inflation, bond yields and energy prices) have a dominant influence. Returns in some other sectors, however, are highly dispersed because stock-specific factors are the predominant driver. Areas where dispersion is higher than average include software, retail and healthcare.
Dispersion of industry groups, 1985-2019
Bubbles (and the bursting of bubbles) temporarily leads to high correlations in asset prices
Unfortunately, the dispersion of returns is not consistent through time. Most notably, correlations can become very high when asset-price bubbles are inflating and when they are bursting. Because a macro factor (irrational exuberance; irrational despair) temporarily overwhelms the micro drivers, we see high levels of market inefficiency. These conditions are the short-term enemy of stockpickers – particularly for investors who, like us, focus on small-caps and mid-caps. But over the long-term, temporarily high correlations can also be our friend…
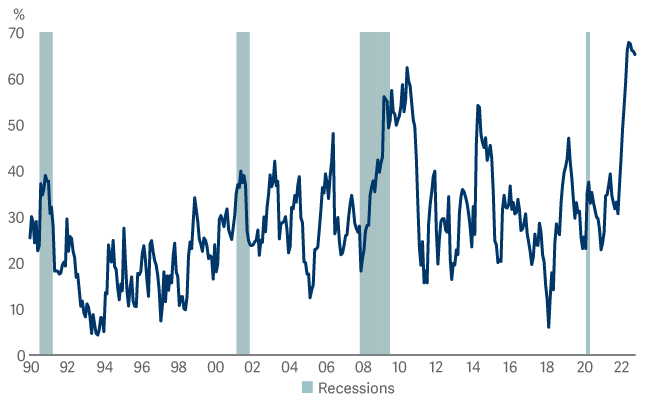
Over the past year or so, ‘profitless growth’ has become a catch-all term used to describe low-quality SPACs and ‘growth-at-any-price’ investments – one synonymous with the most dangerous parts of the market. The following chart shows that the correlation of returns between large-cap, lossmaking growth stocks is at a 32-year high. Valuation multiples of this group of stocks, meanwhile, have fallen to historic lows. The price-to-sales ratio of this group is now 1.47x versus an historic average of 3.8x (a 60% discount) and compared to a 2021 high of 5.4x (a 73% decline).
We currently own three companies that fall into the category of ‘lossmaking growth stock’ but we have strong conviction that their continuing investments in their future growth (rather than sacrificing growth to produce cashflows in the short term) is the correct course.
Large capitalisation growth stock with forecast losses: return correlation between them. 1990 to mid-October 2022
High correlations and low valuation multiples signal opportunity
The excesses of the 2021 liquidity-driven SPAC bubble are behind us. Now that the tide has gone out, we are beginning to see which growth companies were skinny-dipping; many weren’t, but the assumption the market seems to be making is that every high-growth stock left its swimming costume at home.
The result is that correlations are unusually high and valuations are historically low. To us, this is a clear signal that – over a sensible investment horizon – we are likely to see high rates of future return. So we fully expect that what may seem like our enemy in the short-term will be our fond friend over the long term.
FOR PROFESSIONAL INVESTORS AND/OR QUALIFIED INVESTORS AND/OR FINANCIAL INTERMEDIARIES ONLY. NOT FOR USE WITH OR BY PRIVATE INVESTORS. CAPITAL AT RISK. All financial investments involve taking risk which means investors may not get back the amount initially invested.
To ensure you understand whether a fund is suitable for you, please read its Key Investor Information Document or Key Information Document which are available, along with the fund’s Prospectus (or in the case of investment trusts, Investor Disclosure Document and Articles of Association), in the literature library.
Risks specific to Artemis Funds (Lux) – Positive Future
- Market volatility risk: The value of the fund and any income from it can fall or rise because of movements in stockmarkets, currencies and interest rates, each of which can move irrationally and be affected unpredictably by diverse factors, including political and economic events.
- Currency risk: The fund’s assets may be priced in currencies other than the fund base currency. Changes in currency exchange rates can therefore affect the fund’s value.
- Concentration risk: The fund may have investments concentrated in a limited number of holdings. This can be more risky than holding a wider range of investments.
- Charges from capital risk: Where charges are taken wholly or partly out of a fund’s capital, distributable income may be increased at the expense of capital, which may constrain or erode capital growth.
- Emerging markets risk: Compared to more established economies, investments in emerging markets may be subject to greater volatility due to differences in generally accepted accounting principles, less governed standards or from economic or political instability. Under certain market conditions assets may be difficult to sell.
- Specialist investment objective risk: The fund will only invest in companies which have a positive environmental and/or social impact. It is also prevented from investing in companies which conduct certain types of activities. The universe of potential investments available to the fund will therefore be smaller than if no such restrictions were applied. If a company in which the fund invests no longer meets the criteria for investment and/or is not making sufficient progress on improving its operational performance, the manager will seek to sell the investment. The price which may be obtained for selling an investment in these circumstances might be lower than that which could have been obtained had the sale not been required.
Risks specific to the Artemis Positive Future Fund
- Market volatility risk: The value of the fund and any income from it can fall or rise because of movements in stockmarkets, currencies and interest rates, each of which can move irrationally and be affected unpredictably by diverse factors, including political and economic events.
- Currency risk: The fund’s assets may be priced in currencies other than the fund base currency. Changes in currency exchange rates can therefore affect the fund’s value.
- Concentration risk: The fund may have investments concentrated in a limited number of holdings. This can be more risky than holding a wider range of investments.
- Charges from capital risk: Where charges are taken wholly or partly out of a fund’s capital, distributable income may be increased at the expense of capital, which may constrain or erode capital growth.
- Emerging markets risk: Compared to more established economies, investments in emerging markets may be subject to greater volatility due to differences in generally accepted accounting principles, less governed standards or from economic or political instability. Under certain market conditions assets may be difficult to sell.
- Specialist investment objective risk: The fund will only invest in companies which have a positive environmental and/or social impact. It is also prevented from investing in companies which conduct certain types of activities. The universe of potential investments available to the fund will therefore be smaller than if no such restrictions were applied. If a company in which the fund invests no longer meets the criteria for investment and/or is not making sufficient progress on improving its operational performance, the manager will seek to sell the investment. The price which may be obtained for selling an investment in these circumstances might be lower than that which could have been obtained had the sale not been required.