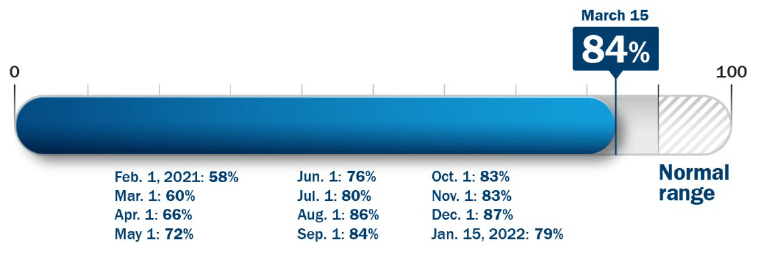
At the beginning of 2021 we created a Return to Normal Index to measure human activity data relative to pre-Covid levels as we progress through recovery. The index is constructed by our data scientists and fundamental analysts and tracks activities in the US including travel, returning to work and school, brick-and-mortar shopping and eating out at restaurants. It is focused on measuring components of daily life rather than economic indicators like GDP growth, and the percentage level moves closer to 100 as daily life normalises. We provide updates on the index when significant changes occur.
What has changed?
A sharp decline in Omicron cases, hospitalisations and deaths in the US is emboldening leaders to remove mask mandates and driving individuals to resume normal activity. In addition to the rapid decline in cases, health leaders evaluated the strong protection created by widening levels of immunity. Across all the categories we track we have seen an improvement of the low levels seen earlier this year, with travel and entertainment activity seeing the greatest gains since our last published update. Restaurants, cafes and events are back – or close – to normal, and air travel and lodging have improved significantly. Return to work activity has lagged in its improvement, but the resumption of corporate initiatives encouraging workers to return to offices, even if on a hybrid schedule, is accelerating. That said, an enduring change out of the pandemic may be a new work from home/work from office balance.

What are we monitoring, and where is it at?
We’re analysing the time people spend engaging in a broad set of activities outside their homes. The index components have implications for economic growth, but the primary objective is to monitor how close or far we are to returning to normal life.
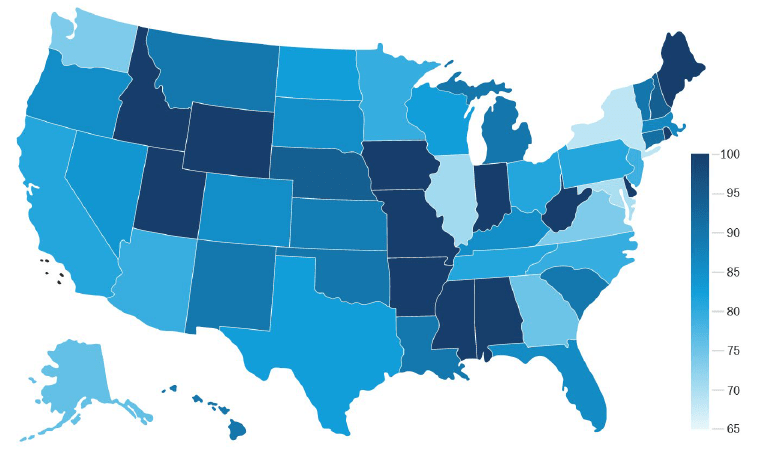
Figure 2: Return to normal state level index

What could drive change?
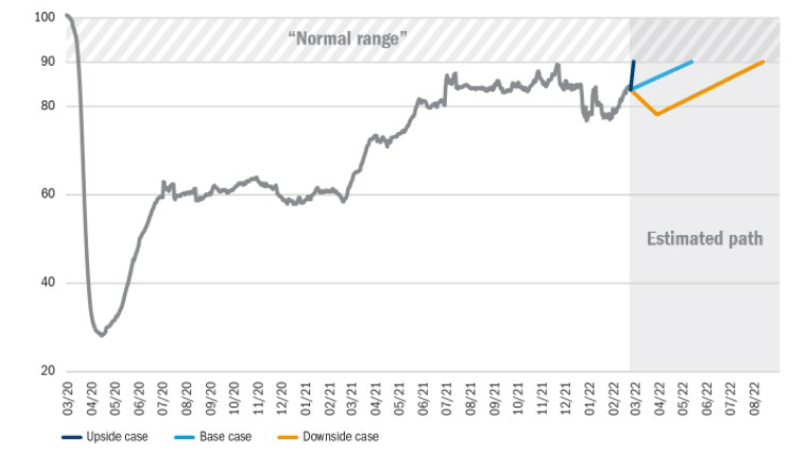
Figure 3: The Return to Normal Index over time – level as of 15 March: 84%


