
Bullish sentiment remains close to record highs. US equity futures positioning by investors excluding market-makers hit a net long of US$290bn, marking the most on record1. Since the beginning of the year, net long positioning has more than doubled, nearly twice as high as during the previous peaks seen in early 2018 and 20202. Meanwhile, US household’s stock allocation as a percentage of financial assets hit a new record of 41.8% in Q2 2024. The Fear & Greed Index is a way to gauge stock market movements and whether stocks are fairly priced. The theory is based on the logic that excessive fear tends to drive down share prices, and too much greed tends to have the opposite effect. The Fear and Greed Index indicates we are currently entering ‘Extreme Greed’ mode compared to a year ago when the market was in ‘Fear’ mode.
Key Takeaways
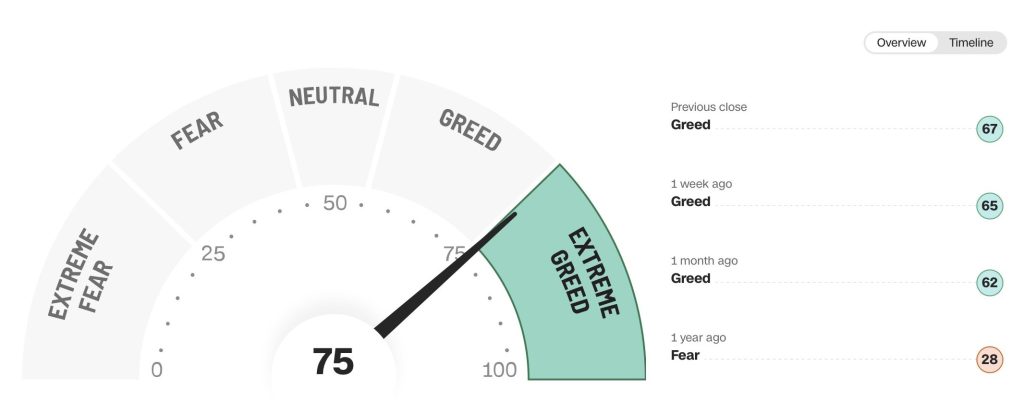
- The Fear and Greed Index indicates we are currently entering ‘Extreme Greed’ mode in stark contrast to a year ago when the market was in ‘Fear’ mode
- The better-than-expected labour market data for September argues for a cautious approach by the Federal Reserve
- Focusing on dividend payers with high quality metrics leads to a portfolio concentrated on highly profitable dividend growers with reasonable valuations
- Related ProductsWisdomTree Global Quality Dividend Growth UCITS ETF – USD Acc, WisdomTree US Quality Dividend Growth UCITS ETF – USD Acc
Find out more
Greed remains at all- time highs
Bullish sentiment remains close to record highs. US equity futures positioning by investors excluding market-makers hit a net long of US$290bn, marking the most on record1. Since the beginning of the year, net long positioning has more than doubled, nearly twice as high as during the previous peaks seen in early 2018 and 20202. Meanwhile, US household’s stock allocation as a percentage of financial assets hit a new record of 41.8% in Q2 2024. The Fear & Greed Index is a way to gauge stock market movements and whether stocks are fairly priced. The theory is based on the logic that excessive fear tends to drive down share prices, and too much greed tends to have the opposite effect. The Fear and Greed Index indicates we are currently entering ‘Extreme Greed’ mode compared to a year ago when the market was in ‘Fear’ mode.
Hotter than expected US inflation sends conflicting message
The latest batch of US macro data has sent contrasting signal to the Federal Reserve and markets. US consumer prices rose by 0.2%mom in September, more sharply than expected3. However, the rather strong increase in prices excluding energy and food (core rate) which tends to provide more information about the trend, re-accelerated from 3.2% to 3.3% annually. This time, the inflation drivers were goods prices which rose slightly by 0.2% instead of the usual decline.
Markets remain laser focussed on the US jobs market
The US jobs report last week also caught markets by surprise. Not only was the actual number at 254k, nearly twice consensus expectations but the prior two months were revised sharply higher4. It’s worth noting the strength in the report can be explained by a record surge in government workers. We also saw the unemployment rate decline. Owing to which, average job growth in the final quarter was actually quite a bit higher than average in Q2.
Re-rating of Fed expectations
The better-than-expected labour market data for September have already moved the basis for speculation about a possible larger 50Bps rate cut by the Federal Reserve (Fed). Now given the further decline in inflation, the room for further dovish pricing in rates appear limited. The recent set of data prints argues for a cautious approach by the Fed. In fact, even a small move of 25Bps may also no longer be a foregone conclusion. Markets are pricing in 45Bps of easing by year end, slightly less than two 25Bps reductions.
Three Federal Open Market Committee (FOMC) members (John Williams, Austan Goolsbee, Tom Barkin) have largely shrugged off the hotter CPI print, with only the hawk Raphael Bostic open to a pause in easing. Bostic, the president of the Atlanta Fed said in an interview, “I am totally comfortable with skipping a meeting if the data suggest that’s appropriate5.”
Analysts slash their expectations for Q3 2024 earnings season
Now earnings season is on deck. The earnings growth expectations for Q3 2024 have been revised down to 3.2%. S&P 500’s profit growth is forecast to rise 4.2%, down from more than 7% expected in mid-July, mostly due to the energy sector, where a big year-over-year drop is now anticipated. While downward revisions are typical for this time of year, it remains a bit of a concern since indices are at or near highs.
Adopting a quality bias in times of greed
Lorem ipsum dolor sit amet, consectetur adipiscing elit. Ut elit tellus, luctus nec ullam
Seasonality, the US elections, earnings and geopolitics all pose a risk to US stocks at a time when sentiment is pointing to extreme greed. Quality stocks tend to perform well across the business cycles. And so, it isn’t surprising that quality is loved by all. Yet quality comes at a price. At WisdomTree we have discovered that the amalgamation of quality alongside the dividend factor tend to offer more reasonable valuations. WisdomTree’s approach to quality is ingrained in profitability. This is why as the upcoming earnings season separates the wheat from the chaff, WisdomTree’s quality suite of products stands ripe to capture that exposure of more profitable companies.
The WisdomTree US Quality Dividend Growth UCITS ETF (Ticker: DGRA), an all-weather dividend fund composed of profitable dividend paying companies listed in the US provides a safer alternative as we enter a period of rising uncertainty. The chart and table below highlight the key strength of DGRA versus its competitors in the form of lowest maximum drawdown (since common history) while at the same time allowing investors to participate in the upside.
corper mattis, pulvinar dapibus leo.
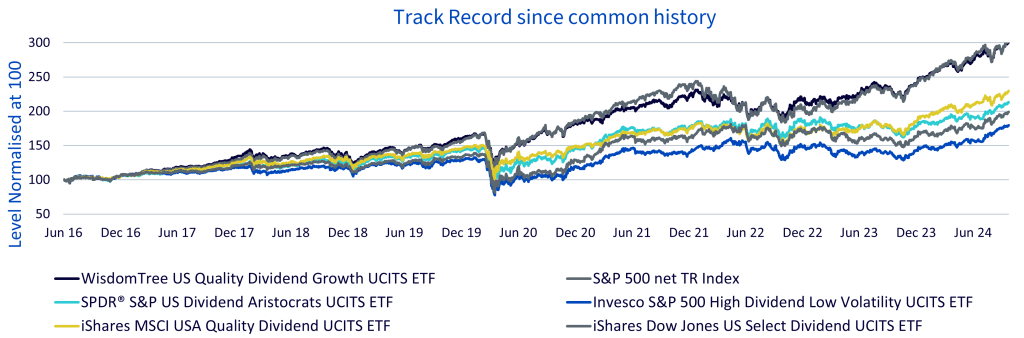

Source: WisdomTree, Bloomberg from 7 June 2016 to 30 September 2024. Calculations are based on NAV in USD. Historical performance is not an indication of future performance, and any investments may go down in value.
Focusing on dividend payers with high quality metrics leads to a portfolio concentrated on highly profitable dividend growers with reasonable valuations evident from the chart below:
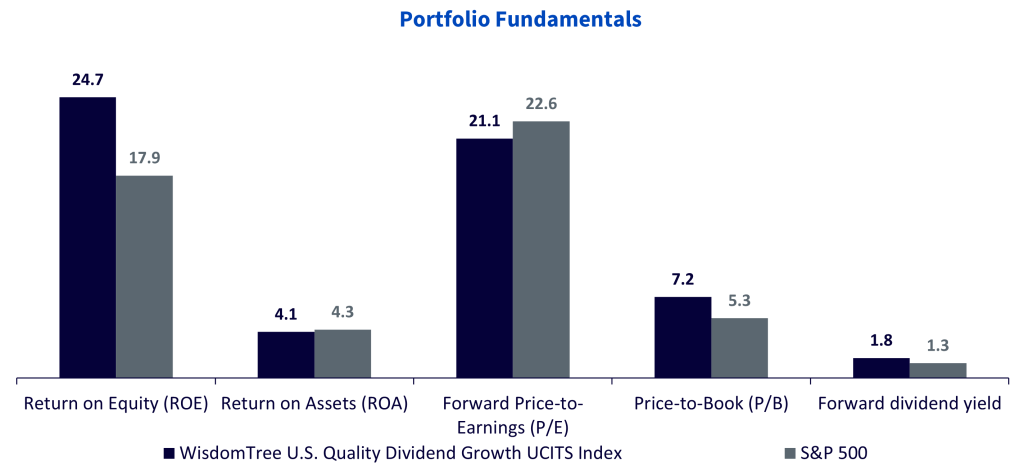
Source: WisdomTree, FactSet as of 30 September 2024. You cannot invest in an index. Historical performance is not an indication of future performance and any investments may go down in value.
1 Goldman Sachs as of 24 Sep 2024
2 The Koeissi Letter
3 Bloomberg as of 10 October 2024
4 Bloomberg as of 4 October 2024
5 Wall Street Journal as on 10 October 2024