One year ago, investors were grappling with macroeconomic uncertainty related to the global Covid pandemic. Today, they feel far more confident about the economic recovery in the nascent post-Covid era, even as the Delta variant poses new threats. However, uncertainty also now lies in value assessment because asset prices appear to fully reflect that economic optimism.
Emerging markets have certainly contributed to the positive trends in both economic indicators and asset prices. But a closer look at the fundamentals underlying EM debt markets reveals favorable changes that could have a long-term impact on risk premia associated with EM-issued bonds and therefore alter how we view current valuations.
2021 is beating growth expectations
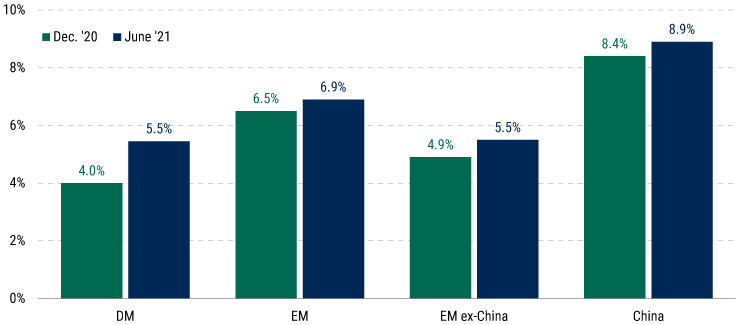
Governments around the world responded to the Covid crisis with a swift deployment of fiscal stimulus, which helped ease the pain of lockdowns but also increased their debt burdens. The multi-year trend of improving current account balances across EMs and confidence in a 2021 economic recovery supported expectations for stabilized debt levels and a willingness among many investors to add EM debt exposure at attractive levels in 2020. This year, economic activity has surpassed already-bullish forecasts, leading to upward revisions of GDP growth projections across all regions.
GDP Growth Forecasts Have Risen in Both Emerging and Developed Markets
December 2020 vs. June 2021
Source: JP Morgan, Citi, and PineBridge Investments as of 9 June 2021. For illustrative purposes only. We are not soliciting or recommending any action based on this material. Any opinions, projections, estimates, forecasts, and forward-looking statements presented herein are valid only as of the date of this presentation and are subject to change.
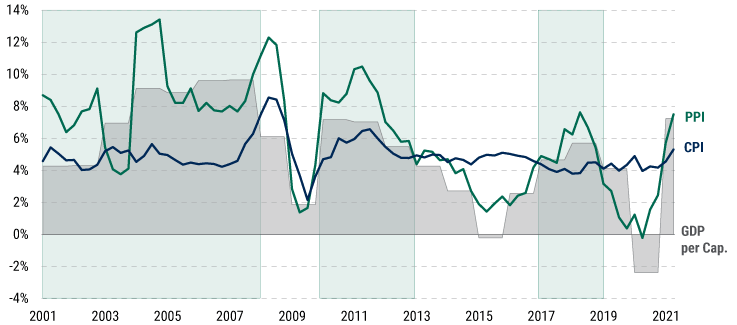
This stronger growth should contribute to a greater-than-expected reduction in debt, but it’s not the sole reason investors now anticipate that debt levels will decline across EMs. While higher consumer prices have sparked more discussion this year, we note the even sharper increase in producer price indices, which track the prices of goods sold as they leave the producer. That makes them a particularly valuable indicator of EM nominal GDP growth, given emerging markets’ role in commodity production and global supply chains. Producer prices rising in excess of consumer prices has a positive wealth effect that can be seen in past periods of strong per capita GDP growth across EMs. And those price increases and wealth creation have a direct impact on tax revenues, which further support EM budget balances. In 2021, producer price index (PPI) gains have outpaced consumer price index (CPI) increases by more than 2%1 across EMs, which will also bolster EM sovereigns’ ability to reduce their debt burdens.v
Emerging Market Producer Price Indices Are Exceeding CPI
Year-over-year change in EM PPI deflator and CPI
Source: JP Morgan, Citi, and PineBridge Investments as of 9 June 2021. For illustrative purposes only. We are not soliciting or recommending any action based on this material. Any opinions, projections, estimates, forecasts, and forward-looking statements presented herein are valid only as of the date of this presentation and are subject to change.
EM corporates enjoy higher revenues and lower debt
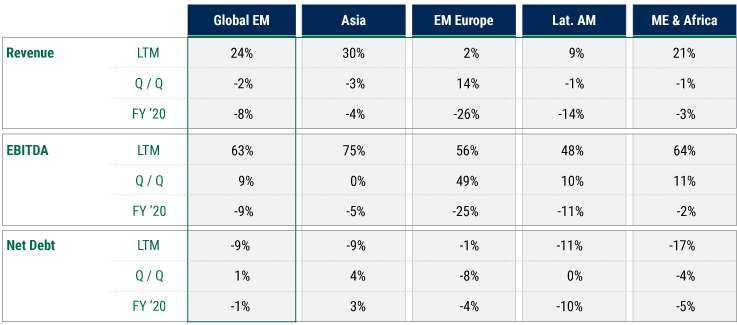
Faster economic growth and rising producer and consumer prices have a direct impact on corporate revenues, helping EM corporates keep beating earnings forecasts. EM corporates’ positive momentum began with a recovery in Asia during the second quarter of 2020, which helped limit the decline in revenues and earnings across emerging markets in 2020. Increases in global mobility and demand have enabled EM corporates to maintain their strong rebound in 2021. We expect the ongoing recovery of global trade, further progress in vaccination efforts, and increased mobility across EMs to sustain the positive momentum. We see this in our internal credit trends, which reflect our six-month forward view of credit metrics and are currently skewed two-to-one positive over negative across our global issuer coverage.
EM Corporates Are Showing Strong Fundamentals
Change in Q1 2021 earnings, revenue, and net debt (%)
Source: JP Morgan and PineBridge Investments as of 3 June 2021. For illustrative purposes only. We are not soliciting or recommending any action based on this material. Any opinions, projections, estimates, forecasts, and forward-looking statements presented herein are valid only as of the date of this presentation and are subject to change.
The strong fundamental backdrop for EM corporates reflects not just the positive earnings trends, but also prudent management of balance sheets. Many EM corporates began cutting capital expenditure budgets heading into 2020, before the Covid pandemic, so plans to further limit outlays were easily implemented from a base of lower spending to begin with. As a result, EM corporates saw a decline of net debt in 2020, and that trend has continued in 2021, with net debt down 9% from Q1 2020.2 Lower debt alongside higher earnings should push leverage ratios to their lowest levels in over a decade.
EM Corporate Debt Is Falling Toward the Lowest Levels in a Decade
Investment Grade Corporate Net Leveraging Ratios
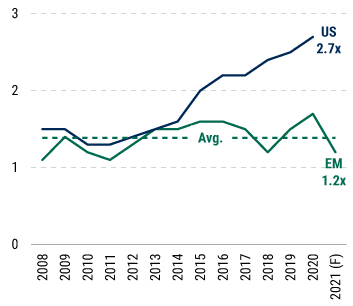
High Yield Corporate Net Leverage Ratios
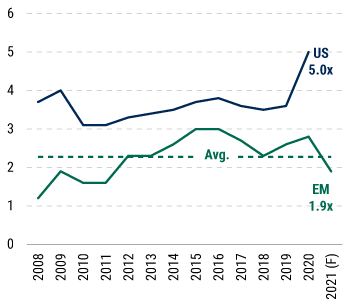
Source: JP Morgan and PineBridge Investments as of 3 June 2021. For illustrative purposes only. We are not soliciting or recommending any action based on this material. Any opinions, projections, estimates, forecasts, and forward-looking statements presented herein are valid only as of the date of this presentation and are subject to change.
Where investors need to focus now
This leads to a key challenge for investors today: how to identify clear investment opportunities in undervalued securities and deploy capital to tap them. That search becomes even more relevant as investors begin to set expectations for a gradual removal of the central bank liquidity that has contributed so much to asset price appreciation. EM debt is no different because valuations appear fair in the context of recent history.
However, the overwhelmingly positive fundamental backdrop will create a broad improvement in credit metrics across EM sovereign and corporate issuers, which could lead to a meaningful trend of positive rating changes. Among sovereigns, more than three times as many are potential upgrade candidates (34) than downgrade candidates (nine), based on current ratings and outlooks across the major rating agencies. Sovereign upgrades and improving credit metrics should contribute to a similar upward migration of corporate ratings. This will no doubt provide a breadth of opportunities for active managers to enhance portfolio returns by identifying the upgrade candidates that should outperform the market. But from an overall perspective, can we rely on past levels of risk compensation to judge fair value of a higher-quality asset class?
Investors must also take supply and demand factors into account when making assumptions about the relative value of EM debt. For all the concern regarding reflation and closing output gaps, bond yields remain historically low, and the global search for yield continues to fuel a wave of investors committing capital to higher-yielding EM bonds. While demand will likely remain strong, the budget discipline we’ve noted will likely lead to lower sovereign issuance. Similarly, the decline of corporate debt levels and capex will have an impact on corporate bond supply as well.
Returning to the question of where investors can find value that will be less vulnerable to a reduction of central bank liquidity, we often hear concerns from investors who recall their experience in EM debt during the 2013 taper tantrum. They worry that EM debt will again find itself on the razor’s edge of a cut in central bank liquidity. However, our analysis of past periods of monetary policy tightening shows that under most conditions, when tightening occurs alongside positive global growth dynamics, EM debt outperforms global bond markets. The issue in 2013 had more to do with the unexpected nature of the taper announcement, a concern that the US Federal Reserve has carefully addressed with consistent forward guidance.
We also point out that EMs find themselves in a far more favorable fundamental position today than in 2013. They’ve made material improvements in managing current accounts, which are in surplus for many. As noted, we see EM corporates’ leverage ratios reaching their lowest levels since 2011, and careful management of near-term maturities should ensure ample liquidity for EM corporates even amid tighter central bank policy.
In an environment where nearly all capital markets range from fairly valued to overvalued, investors should look to identify areas where forecast levels may be based on outdated assumptions. The overwhelmingly positive fundamental backdrop and supportive technical dynamics could call for a recalibration of EM risk premia, making current EM debt valuations seem attractive from a longer-term perspective.
Footnotes
1 Source: JP Morgan, Citi, and PineBridge Investments as of 9 June 2021.
2 Source: JP Morgan and PineBridge Investments as of 3 June 2021.

