

Investors may be experiencing whiplash from watching wild market swings as the tariffs saga evolves. From a “Liberation Day” sell-off, through a tariff-pause rebound, to a reduction of steep quotas against China, investors have gone from stagflation worries to increased optimism. Uncertainty remains since tariffs, by and large, were only postponed. But if the de-escalation of trade tensions continues and tax cuts materialize, US small and mid caps may benefit.
Catch-up Potential
Despite being less exposed to international markets, US small- and mid-cap indices suffered from elevated volatility as the potentially massive size of tariffs raised stagflationary concerns. This has had a detrimental effect on cyclical, rate-sensitive and “risk-on” small- and mid-cap exposures. As tensions de-escalated, first with a majority of US trade partners and more recently with China, the Russell 2000® Index, the S&P MidCap 400® Index and the MSCI USA Small Cap Value Weighted Index all rallied sharply and remain above the levels observed at the beginning of Q2.
The trade tantrum appears to be giving way to orderly trade negotiations, even if more significant tariffs have only been temporarily paused. This bodes well for higher risk-reward exposures like US small and mid caps, especially if domestic investments increase and the US administration delivers on fiscal easing through a more benign tax policy later this year.
Figure 1: Index Performance YTD

Soft Landing Is Increasingly Likely
US economic exceptionalism has been challenged as widespread uncertainty led to negative 0.3% growth in Q1, and estimates for 2025 and 2026 were downgraded respectively from 2.1% and 2.0% at the beginning of the year to 1.4% and 1.5% as of 14 May.1 These levels, while less appealing, are still solid and the probability of a recession is lower as the likelihood of orderly trade negotiations has increased. Since growth estimates were downgraded during the recent uncertainty, there is now a chance for upgrades from current levels, potentially benefitting more domestic exposures — especially if tax cuts materialize.
Inflation, previously a key headwind for small- and mid-cap performance, is abating. April’s CPI and Core CPI both came in at 0.2% month on month, below the 0.3% estimates.2 Moderating inflation should allow the Federal Reserve (Fed) to cut rates three times this year. April’s reading indicates that, at least for the time being, tariffs have had a limited impact on inflation. This lowers the risk for rate-sensitive US small and mid caps.
Low unemployment remains the brightest spot in the US economy, with the current rate at 4.2%.3 A tight labour market provides a foundation for growth and US consumer resiliency — a crucial element for small- and mid-cap indices that generate between 77% to 84% of their revenue within the US.4
The combination of softer but positive growth, moderating inflation, and a resilient labour market creates a favourable environment for risky assets to flourish.
Cyclicality for Brightened Outlook
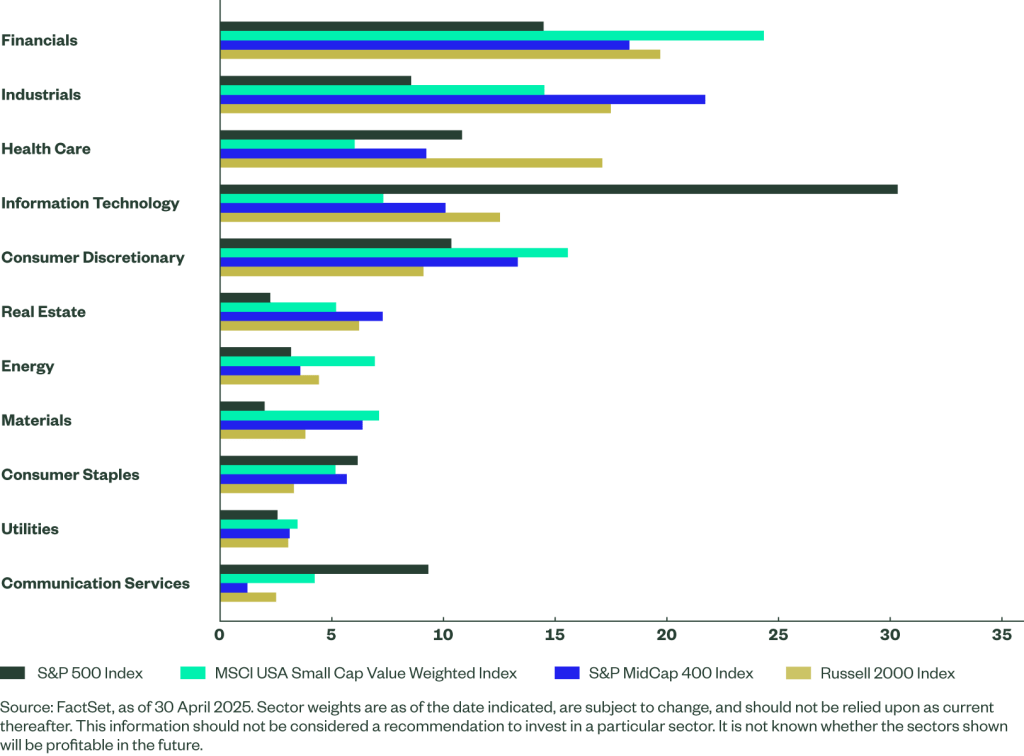
The first four and a half months of the year were driven by volatility so defensive exposures were more in demand than cyclicals, particularly in the US. This is now changing. As chaotic trade policies give way to a more orderly negotiation process, and as long as the economic outlook remains solid, cyclical exposures may be rewarded. US small and mid caps are procyclical, overweighing Financials, Industrials, Real Estate, and Materials relative to the S&P 500® Index. However, each strategy has a unique profile:
- The S&P MidCap 400 Index offers the most traditional sector composition — Industrials is the largest sector — which is appealing in the context of reshoring and increased domestic investments. Constituents tend to be more mature due to relatively higher size and S&P profitability requirements.
- The Russell 2000 Index overweights biotech and software companies, which often are in the earlier stages of development. This means the index has a higher risk-return profile.
- The MSCI USA Small Cap Value Weighted Index is skewed towards Financials which represent more than a quarter of the index. The sector may benefit from the combination of a solid consumer, lowered uncertainty, and relatively high rates. The index has the highest Technology underweight relative to the S&P® 500 Index.
Figure 2: Sector Composition
Affordable Valuations Allow for Further Upside
Equities have largely recouped the losses incurred after Liberation Day. From here, small and mid caps trading at more affordable valuation multiples may benefit to a larger extent, as long as the uncertainty continues to abate.
But there are caveats. The Russell 2000 Index’s exposure to companies with negative earnings is close to 30%5 due to a significant number of biotech and software companies that have yet to break even. Its unconstrained index structure makes the Russell 2000 a relatively high risk, high reward exposure. But it also trades at attractive P/E ratios using positive earnings relative to large caps and relative to its own history.
The S&P MidCap 400 may be more appealing to investors looking for higher quality exposures as the index includes only companies that have a record of positive earnings. Despite the higher quality, the index trades at affordable multiples.
And the MSCI USA Small Cap Value Weighted Index has, by design, the strongest value tilt.
Figure 3: Price-to-earnings Multiples Using FY1 Estimates (Excluding Negative Earnings)

Gain Exposure to US Small and Mid Caps
R2US LN
SPDR® Russell 2000 U.S. Small Cap UCITS ETF (Acc)
SPY4 LN
SPDR® S&P® 400 U.S. Mid Cap UCITS ETF (Acc)
USSC LN