

ETFs gathered $42 billion in September as the pace of flows into core equity exposures moderated. Fixed income ETF flows ticked up slightly.
- Europe-domiciled ETFs attracted $41.8 billion of assets in September, with both equity and bond ETFs seeing healthy inflows.
- Equity ETFs collected $29.2 billion in new assets, while fixed income exposures saw $9.2 billion of net inflows.
- The Vanguard UCITS ETF range captured net inflows of $7.5 billion in September, with the majority recording positive flows.
Monthly recap: ETFs cap another record quarter
While headline ETF inflows moderated in September relative to the previous month, the torrid pace from the July-August period drove Q3 flows to a record high. Investor sentiment remained stable amid a resilient global economy and healthy corporate earnings – and despite elevated rates and persistent geopolitical tensions. Commodity prices surged as renewed concerns over energy supplies introduced a degree of market uncertainty.
In this environment, commodity ETFs have seen unprecedented flows. Q3 net inflows totalled $13.4 billion, far ahead of the previous quarterly high of $1.6 billion, in Q3 2025. And commodity ETFs have now seen positive flows for five straight months, their longest streak of inflows going back to the start of 2024.
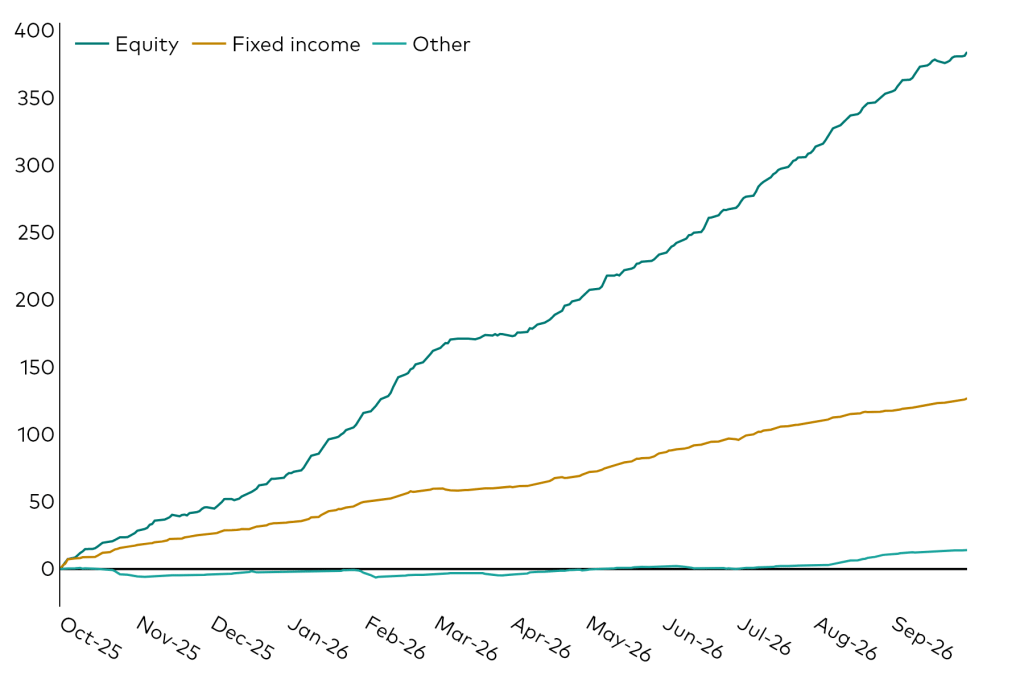
Equity ETFs captured $29.2 billion of net inflows in September, netting a quarterly haul of $113.9 billion. Core equity ETFs accounted for $20.6 billion of net inflows last month, with investors favouring global, developed market and US exposures. Sustainable and smart beta equity ETFs also enjoyed a relatively strong month.
Fixed income ETFs saw $9.2 billion of net inflows in September, bringing the Q3 total to $30.9 billion. Government bond ETFs had $4.0 billion of net inflows for the month, while ultra-short and corporate exposures also welcomed healthy flows. On a regional basis, investors focused on US, euro area and global bond ETFs.
Alternative ETFs enjoyed net inflows of $139.0 million in September while multi-asset ETFs had net inflows of $72 million.
Following the Q3 surge, 2026 flows stand at $415.9 billion year to date. That’s already well ahead of the 2025 full-year total of $371.7 billion, with three months to go.
Total ETF market flows
ETF inflows soften slightly in September
European ETF cumulative flows – cumulative 12 months by asset class ($ billion)
Equity ETFs
Core category dominance continues
Equity flows by category: Month to date ($ million)
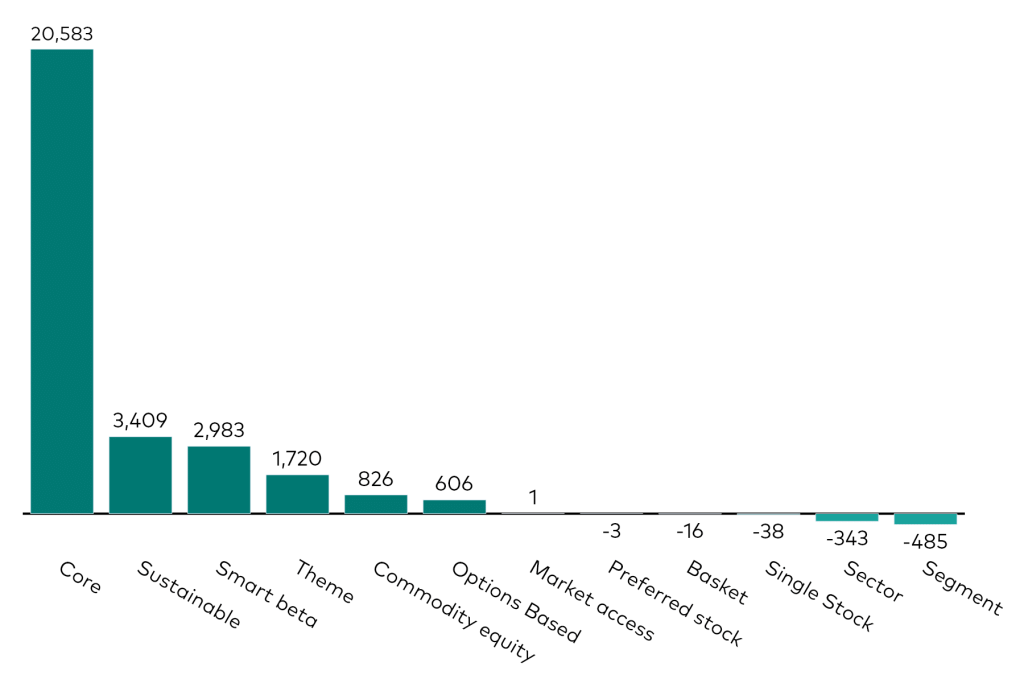
Core equity ETFs posted $20.6 billion of net inflows in September, far outpacing other categories. For the year, core equity ETFs have averaged $21.7 billion of inflows per month. Sustainable ETFs added $3.4 billion of net inflows in September while smart beta equity ETFs took in $3.0 billion. Segment and sector equity ETFs endured net outflows of -$485 million and -$343 million, respectively.
Global equity ETFs reclaim the top spot
Equity flows by geographic exposure: Month to date ($ million)
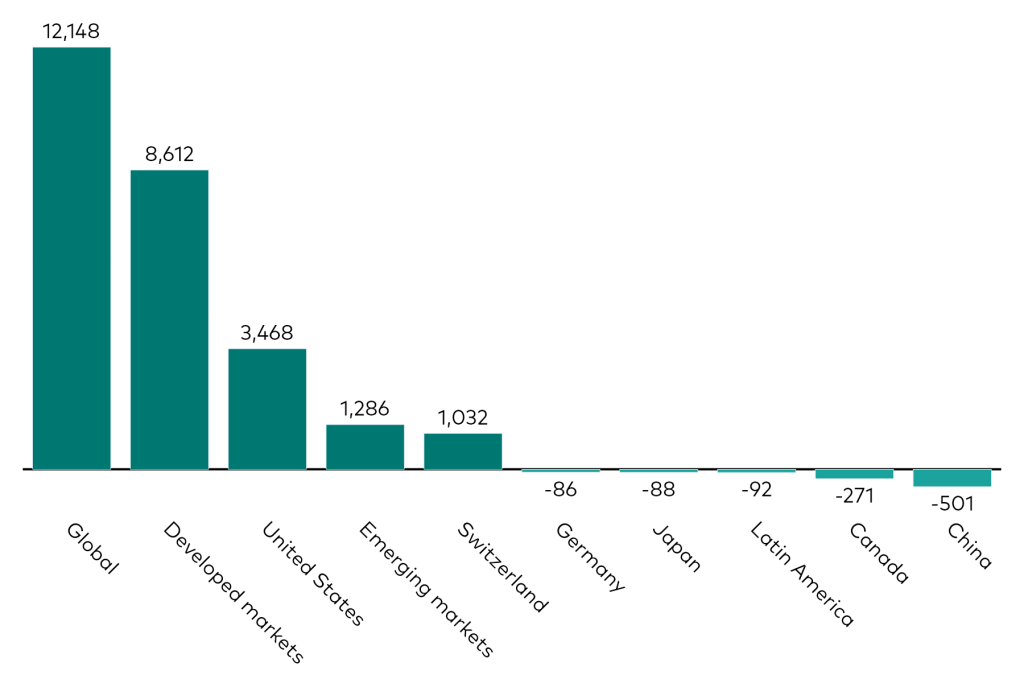
Following three months of investors favouring US equity ETFs, global is back on top. Global equity ETFs gathered $12.1 billion of net inflows in September, while developed market and US equity ETFs took in $8.6 billion and $3.5 billion, respectively. In terms of outflows, China and Canada equity ETFs saw net outflows of -$501 million and -$271 million, respectively.
Fixed income ETFs
Investor preference for government bond ETFs endures
Fixed income flows by category: Month to date ($ million)
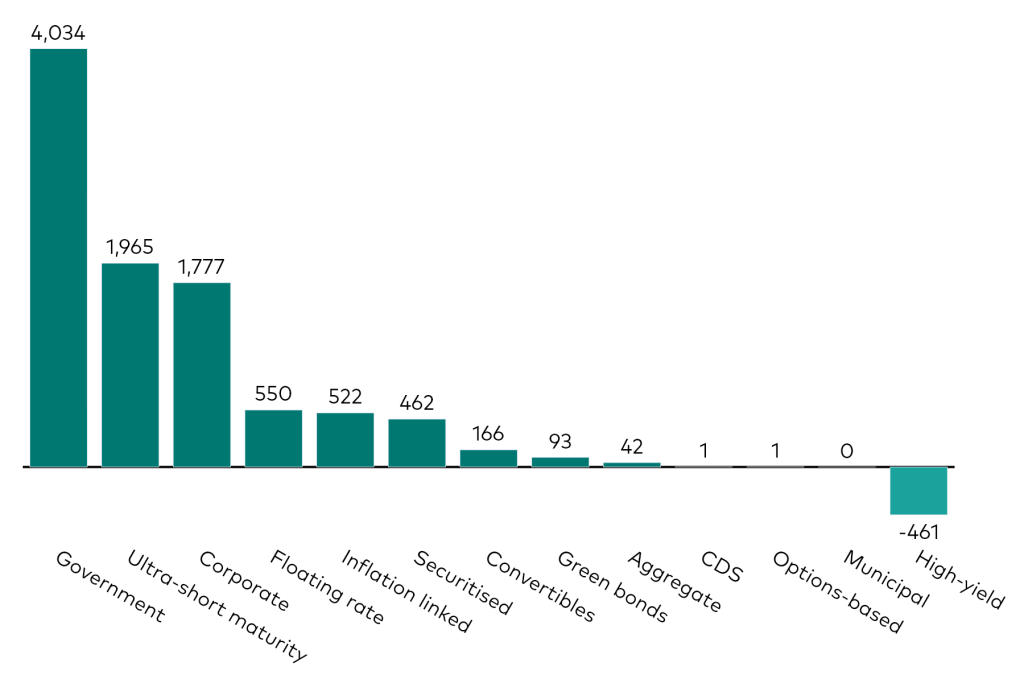
Government bond ETFs again topped the flows table, gathering $4.0 billion in September. The category has attracted net inflows in every month but one this year, totalling $35.1 billion. Ultra-short maturity and corporate bond ETFs also welcomed net inflows, adding $2.0 billion and $1.8 billion in September, respectively. High-yield bond ETFs, on the other hand, weathered net outflows of -$461 million.
US bond ETFs top the table again
Fixed income flows by geographic exposure: Month to date ($ million)
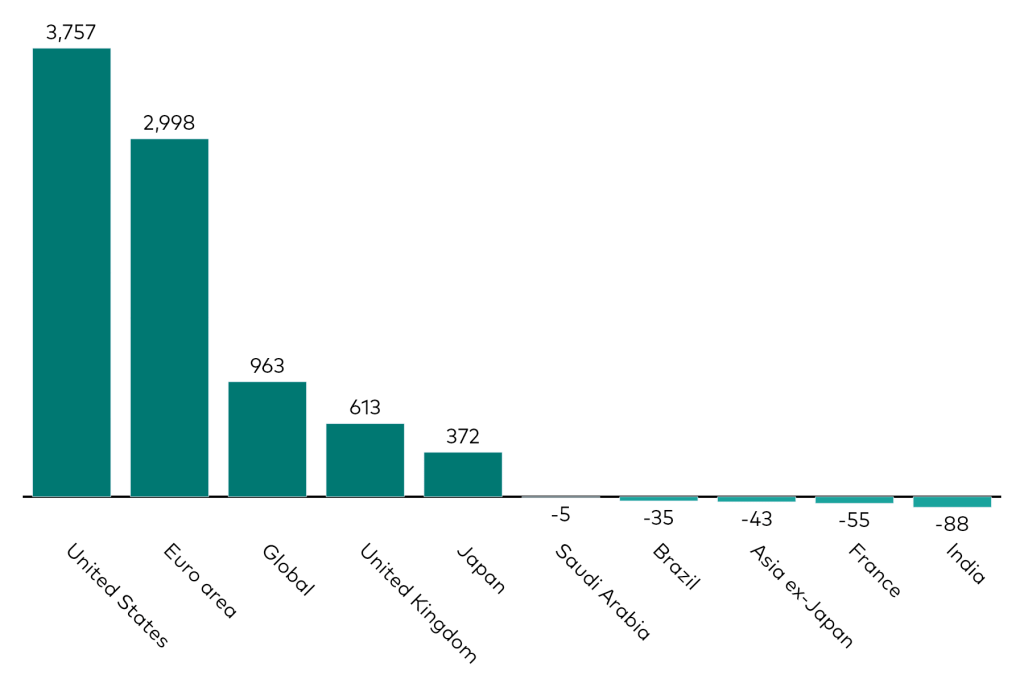
For just the second time this year, US bond ETFs captured the highest monthly net inflows, adding $3.8 billion in September. Euro area bond ETFs, meanwhile, saw $3.0 billion of net inflows and global bond ETFs attracted $963 million. On the negative side of the ledger, we observed only minor net outflows.
Vanguard UCITS ETFs
Vanguard range sees net inflows of $7.5 billion in September
Vanguard UCITS ETF net flows: Month to date ($ million)
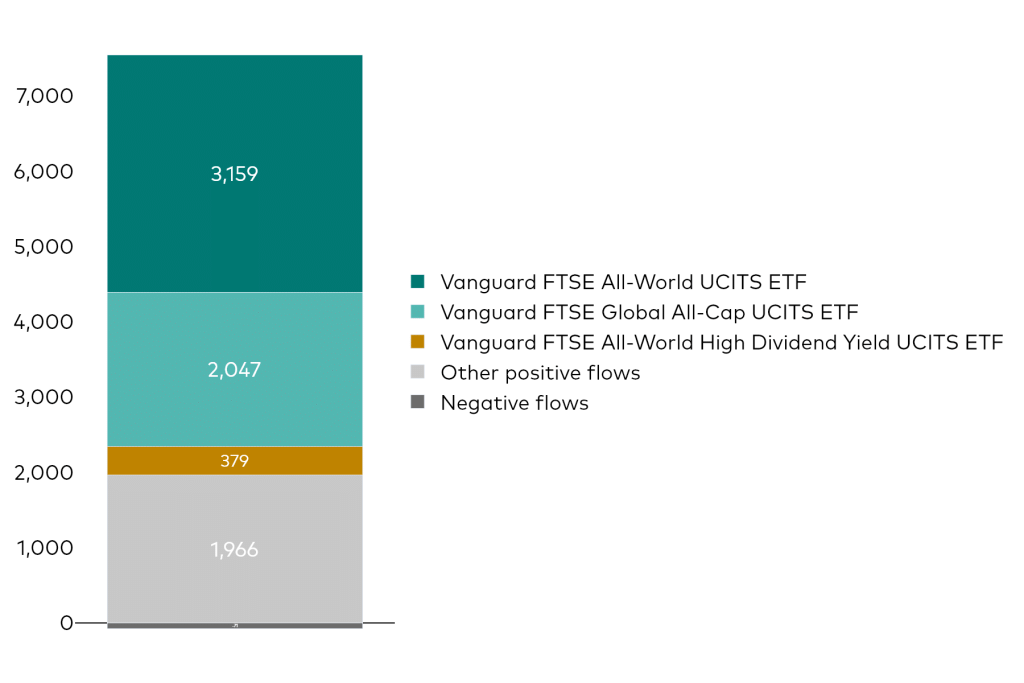
The Vanguard UCITS ETF range captured net inflows of $7.5 billion in September, with the majority recording positive flows. Inflows came mainly from Vanguard’s equity ETF range ($6.7 billion) and fixed income ETF range ($631 million). The multi-asset ETF range ($95 million) and cash ETF range ($47 million) also saw net inflows.