
Marketing Communication. Capital at Risk. For Professional Investors Only.
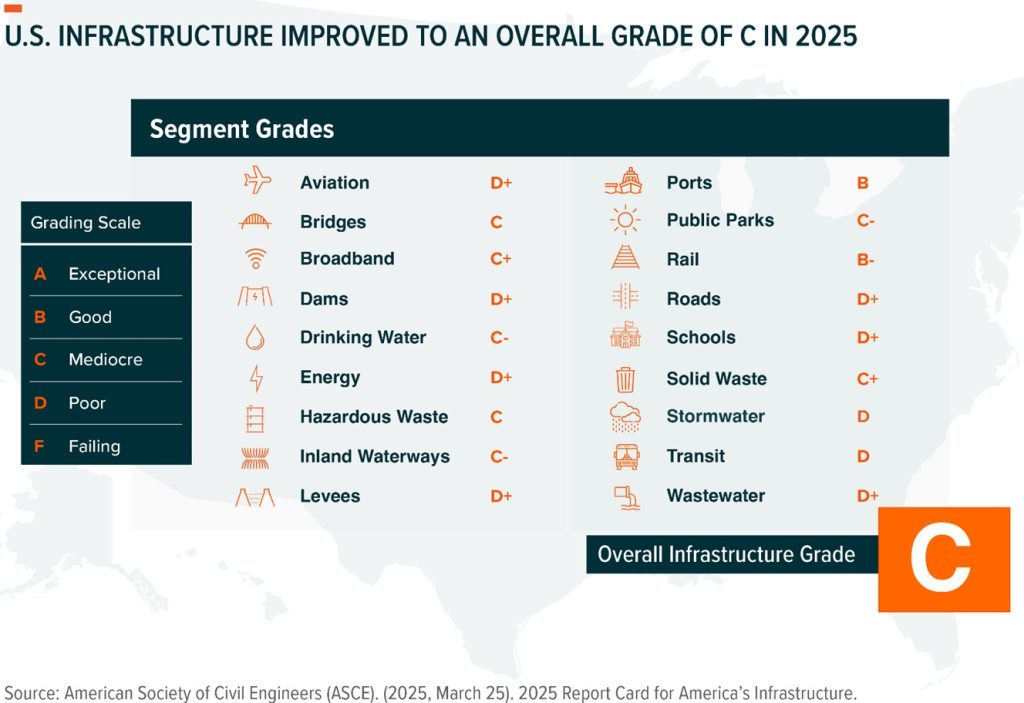
In late March, the American Society of Civil Engineers (ASCE) released its 2025 Report Card for America’s Infrastructure. In the latest version of this quadrennial report, the United States earned an overall grade of C, improving from a C- in 2021.1 While this indicates some progress, it could underscore a deeper challenge: without continued investment, ageing infrastructure assets, including roads and energy infrastructure, could become a drag on economic growth.2
Federal and state funding has improved several key infrastructure categories, but the ASCE estimates that $9.1 trillion in investments are still needed over the next decade to further improve, modernise, and maintain critical systems.3 The Report Card indicates a funding gap of at least $3.6 trillion currently exists, which could indicate a potential opportunity for developers and investors alike.4
Key takeaways:
- Many infrastructure segments within the United States have benefitted from higher levels of funding and investments over the past four years, causing the overall grade to rise from a C- in 2021 to a C in 2025.5
- Nearly half of the assessed categories, including energy, aviation, and transit, still received a grade in the D range, pointing to the need for significant and sustained investment into U.S. infrastructure development. The ASCE estimates $9.1 trillion over the next decade will be needed to improve and maintain the performance of U.S. infrastructure.6
- Improving policies, including the federal permitting process and prioritising resilience, could potentially help further minimise disruptions and risks to U.S. infrastructure assets.7
U.S. Infrastructure Has Improved Over the Past Four Years
The 2025 Infrastructure Report Card could mark a milestone for U.S. infrastructure. Not only is a C the highest overall grade received since the report began in 1988, but for the first time ever none of the assessed infrastructure asset categories received a D- or lower.8 The grades consider criteria related to current and future capacity, conditions, funding, resilience, operation and maintenance, and safety. The assessment considers key questions, such as whether the infrastructure system’s capacity meets current and future demands, the infrastructure systems existing and near-future physical condition, the costs to improve the infrastructure, and whether an infrastructure system has the capability to prevent, protect, or quickly recover from multi-hazard threats and incidents.9
Improvements in both the overall grade and many segment grades appear to be the result of increased federal and state funding for infrastructure development over the past few years.10 The Infrastructure Investment and Jobs Act (IIJA), which was enacted into law in November 2021, allotted $1.2 trillion in total funding, including hundreds of billions in new direct funding towards the modernisation and expansion of U.S. infrastructure assets.11 As of November 2024, more than $568 billion in funding from the IIJA had been allocated towards 66,000 state-level projects, spanning assets from bridges to roads, airports, and electric vehicle (EV) charging stations.12
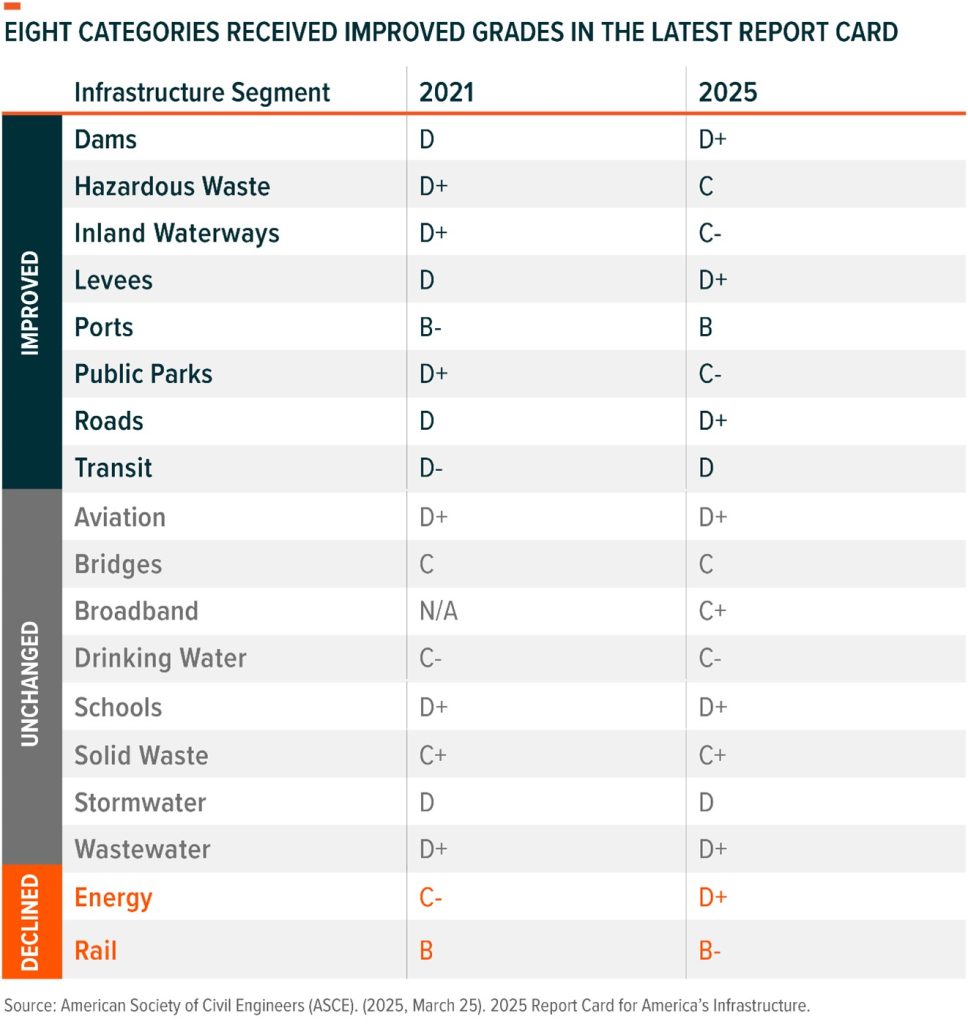
8 of the 18 assessed categories saw an improvement from the 2021 report, including transit, roads, dams, levees, ports, inland waterways, hazardous waste, and public parks.13 For example, while the average age of U.S. dams is still greater than the average lifespan, billions of dollars in federal funding helped boost dam safety and rehabilitation. For U.S. ports, a near-doubling in annual funding levels in recent years has resulted in more than 1,060 port and waterways projects and a better ability to assess and address demand levels.14 The IIJA provided $108 billion in support for U.S. transit systems, which helped accelerate long-sought projects, like the Hudson Tunnel Project.15
Sustained Investment Appears Necessary to Maintain Momentum and Help Further Improvements
Despite improvements, the ASCE’s latest report emphasises that there is still significant work to be done to improve and maintain infrastructure across the United States. Although the improved overall grade shows progress, a C grade stands for “Mediocre, Requires Attention,” meaning that there are still widespread signs of deterioration and some elements exhibiting significant deficiencies and increased risks.16 Additionally, nine categories, including aviation, transit, dams, energy, roads, and wastewater, received either a D or D+, translating to “Poor, At Risk” status. This means that these nationwide systems are in fair to poor condition and “mostly below standard, with many elements approaching the end of their service life.” 17 In an era of intensifying demands on infrastructure and rising risks from extreme weather events, their conditions and capacities are “of serious concern with strong risk of failure.”18
In total, the ASCE estimates $9.1 trillion in investments into infrastructure development will be needed between 2024 and 2033 for the United States to keep improving the quality of its infrastructure assets.19 With $5.45 trillion in public and private investments outlined for infrastructure developments between 2024 and 2033,20 there could potentially be a multi-trillion-dollar investment gap that may need to be filled by sustained, or in some cases potentially increased, federal, state, and private investments.21
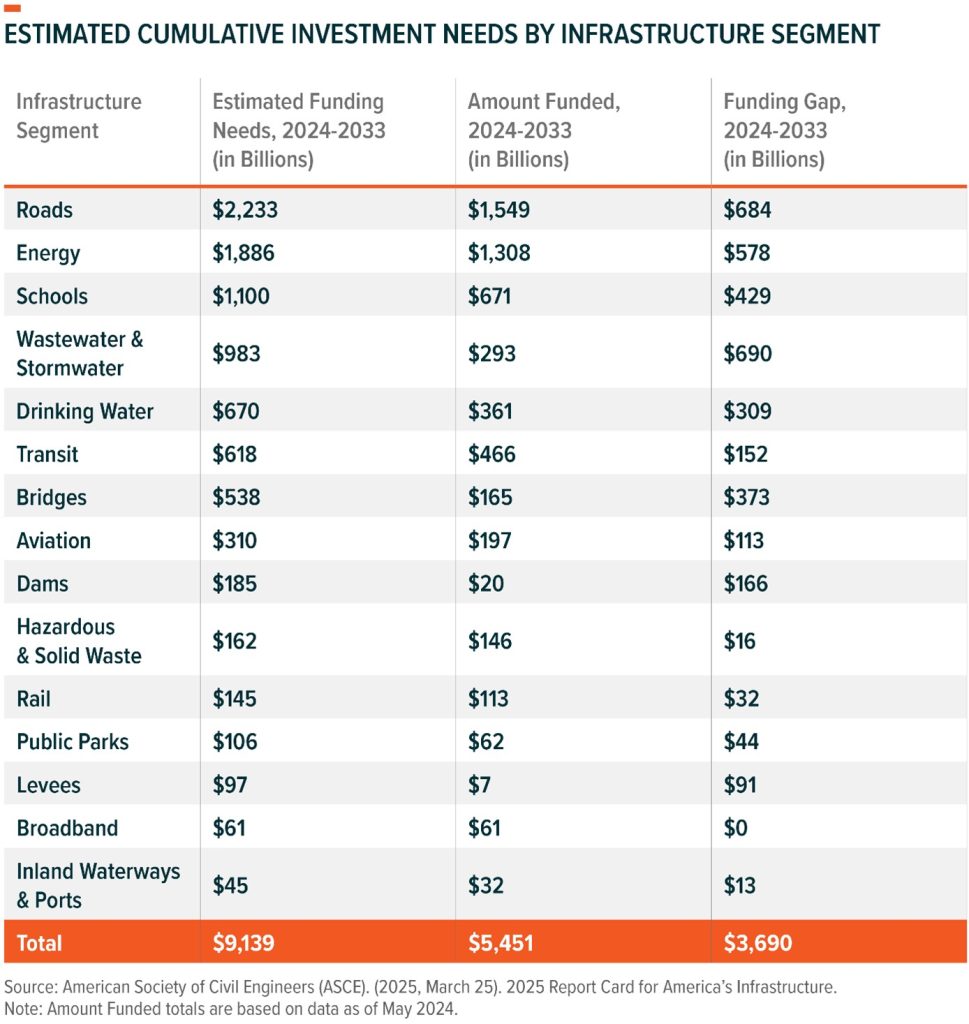
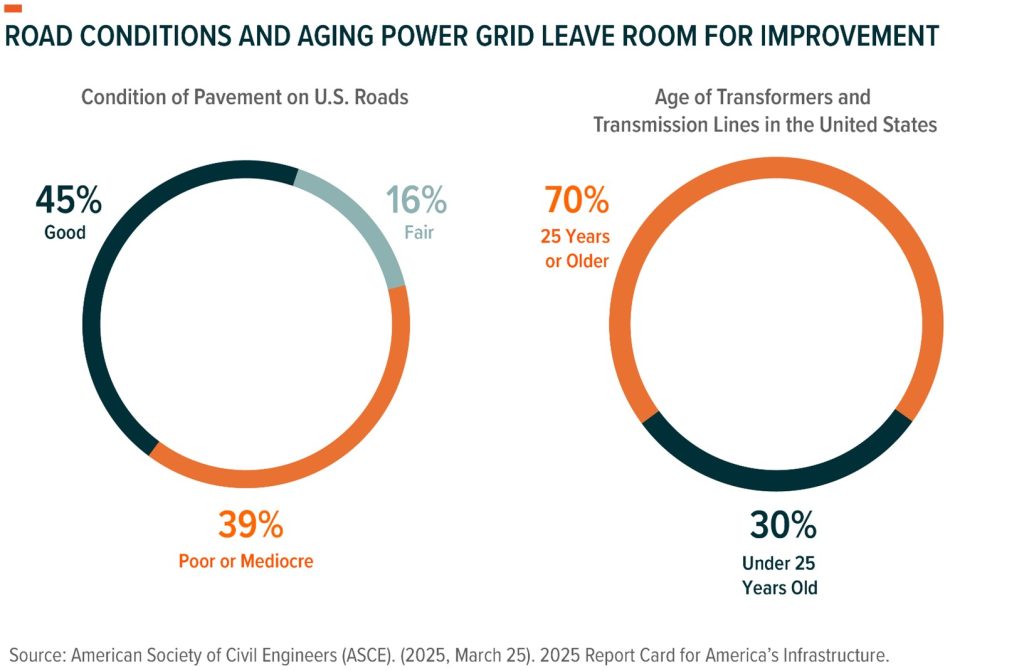
The Report Card indicates that the roads, energy, and schools segments are those with the highest estimated investment needs through 2033.22 The grade for the roads segment improved only slightly from a D in 2021 to a D+ in 2025.23 Nearly 40% of major roads in the United States remain in poor or mediocre condition, while another 16% are in fair condition. Every year, the average U.S. driver incurs over $1,400 per year in operating costs and lost time from driving on deteriorated and congested roads.24 To improve the U.S. roadway network, it is estimated that over $2.2 trillion will need to be invested through 2033, and there is a projected $684 billion investment gap.25
The energy segment was downgraded from a C- in 2021 to a D+ in 2025, largely due to safety risks and concerns that electricity infrastructure capacity will not be able to keep up with future demands.26 Peak winter and summer electricity demand could increase by 18% and 15%, respectively, by 2034.27 By 2040, total U.S. annual electricity demand could increase by as much as 47% compared to 2023 levels.28,29, However, years of underinvestment into transmission and distribution infrastructure and lengthy and complex permitting processes appear to have resulted in an aging grid that is increasingly at risk of disruptions.30 Expanding and modernising the grid to keep up with future demand and minimize risks is estimated to require nearly $1.9 trillion through 2033.31
Even segments with higher grades, like bridges and ports, are estimated to need sizeable investments over the coming years in order to perform adequate maintenance, improve resilience, and meet anticipated levels of demand in the future.32 While U.S. bridges maintained a C grade between 2021 and 2025, the number of bridges in fair condition is surpassing those in good condition.33 Additionally, the average age of existing bridge assets is 47 years, compared to an average lifespan of 50 years.34 Of the 621,218 bridges in the United States, 6.8% are in poor condition, 49.1% are in fair condition, and 44.1% are in good condition.35 The ASCE forecasts that bridges will require $538 billion in cumulative investment needs between 2024 and 2033.36
Improving Policies and Prioritising Resilience May Accelerate Developments and Potentially Reduce Risks
In addition to sustained investment in U.S. infrastructure, the ASCE outlines two additional suggested priorities for the next four years to continue improving the nation’s grades: 1) Prioritise Resilience and 2) Advance Policy and Innovation.37
Prioritise Resilience
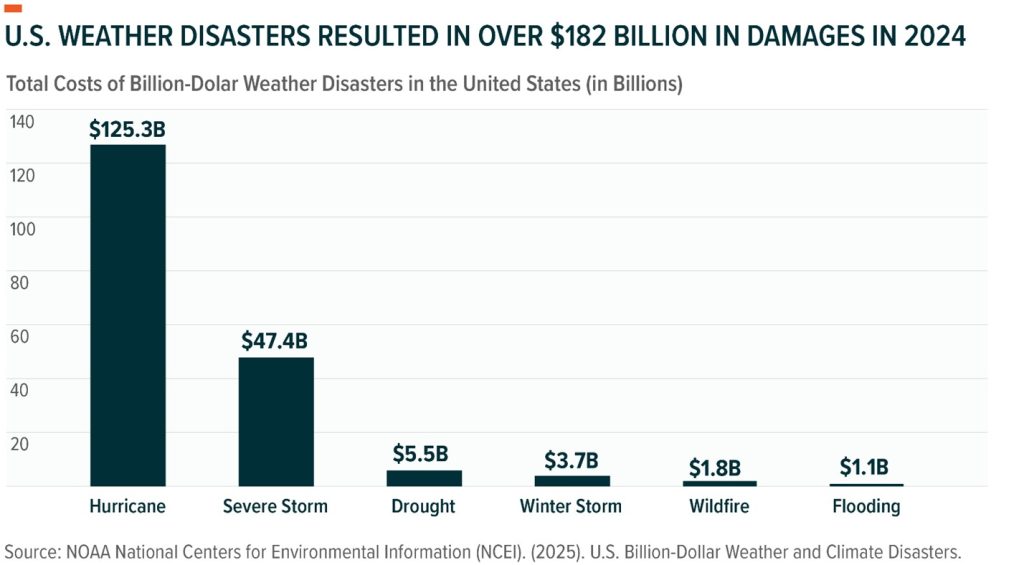
Resilience is becoming increasingly important given that the frequency and severity of extreme weather events could well increase. In 2024, 27 extreme weather events within the United States resulted in over $182 billion in economic damages.38
Going forward, building stronger infrastructure assets, adhering to the most up-to-date codes that mitigate risks to events such as floods and fires, implementing better risks analyses, and being mindful of resilience in project planning could potentially be beneficial to the country’s overall infrastructure quality.39 By one estimate, every dollar spent on resilience can save communities $13 in post-disaster costs.40 Companies that offer services such as risk management and resilience planning, critical infrastructure protection, power management solutions, and disaster risk reduction could potentially benefit from an increased focus on resilience.
Advance Policy and Innovation
The ASCE also suggests recognising and addressing the need to reduce delays from project permitting processes. Complex and slow permitting processes remain one of the greatest headwinds for developers within many infrastructure segments. Despite reform efforts in 2023, 61% of reviews for Environmental Impact Statements, a key step for receiving environmental approval, still exceed the two-year review deadline.41
Some projects are impacted by permitting, as they require obtaining approval across both the government and state level.42 For example, it took 17 years for the SunZia transmission line project to gain full approval from 10 federal agencies, five state agencies, and nine local authorities.43 The U.S. Department of Energy estimates that transmission systems will need to expand 60% by 2030 in order to support power capacity growth and the transition towards more renewables.44
Improved permitting policies could therefore potentially accelerate improvements and increase the number of development opportunities in many U.S. infrastructure networks.45 Companies throughout the U.S. infrastructure development value chain could potentially benefit here.46
Conclusion: Ageing Infrastructure Could Become a Tailwind for U.S. Infrastructure Development
The United States’ interconnected system of infrastructure networks lies at the centre of its national economy.47 While many of these systems have improved over the past four years, significantly more work, and investments, appear to be needed to support future demand and ensure public safety.48 Ultimately, U.S. infrastructure in some areas remains largely outdated, and there could be risks associated with growing demand, shifting extreme weather patterns, and the adoption of advanced technologies.49
This document is not intended to be, or does not constitute, investment research as defined by the Financial Conduct Authority
1. American Society of Civil Engineers (ASCE). (25/03/2025). 2025 Report Card for America’s Infrastructure.
2. Kearney, America at 250. (04/2015).
3. American Society of Civil Engineers (ASCE). ((25/03/2025). 2025 Report Card for America’s Infrastructure.
4. Ibid.
5. Ibid.
6. Ibid.
7. United Nations Office for Disaster Risk Reduction. Accessed 16/06/2025.
8. American Society of Civil Engineers (ASCE). ((25/03/2025). 2025 Report Card for America’s Infrastructure.
9. Ibid.
10. SmartBrief (26/03/2025) The US just got its best infrastructure report card, but work is far from over
11. Government Finance Officers Association. (2025). Infrastructure investment and Jobs Act (IIJA) Implementation Resources.
12. The White House. (n.d.). Investing in America: Build.gov. Accessed on 16/06/2025.
13. American Society of Civil Engineers (ASCE). (25/03/2025). 2025 Report Card for America’s Infrastructure.
14. Ibid.
15. Ibid.
16. Ibid.
17. Ibid.
18. Ibid.
19. Ibid.
20. Ibid.
21. Global Infrastructure Investor Association (GIIA). (29/03/2025) The untapped potential of private capital in American infrastructure.
22. American Society of Civil Engineers (ASCE). (25/03/2025). 2025 Report Card for America’s Infrastructure.
23. Ibid.
24. Ibid.
25. Ibid.
26. Ibid.
27. North American Electric Reliability Corporation. (31/12/2024). 2024 Long-Term Reliability Assessment.
28. NextEra. (23/10/2024). Third Quarter 2024 Earnings Conference Call. [Presentation]
29. U.S. Energy Information Administration. (10/12/2024). Short Term Energy Outlook.
30. Global Infrastructure Investor Association (GIIA). (27/02/2025) Energy bottlenecks are threatening renewables – here’s how smarter grids can fix it
31. American Society of Civil Engineers (ASCE). (2025, March 25). 2025 Report Card for America’s Infrastructure.
32. Ibid.
33. Ibid.
34. Ibid.
35. Ibid.
36. Ibid.
37. Ibid.
38. NOAA National Centers for Environmental Information (NCEI). (2025). U.S. Billion-Dollar Weather and Climate Disasters.
39. United Nations Office for Disaster Risk Reduction. Accessed 16/06/2025.
40. U.S. Chamber of Commerce. (25/06/2024). The Preparedness Payoff: The Economic Benefits of Investing in Climate Resilience.
41. Bipartisan Policy Center. (28/01/2025) Permitting Speeds Up, but 61% of Reviews are Still Late.
42. KPMG (2023). Permitting: Streamlining delivery of today’s infrastructure opportunity. Accessed 16/06/2025
43. ClearPath. (26/03/2025). How to Modernize our Permitting System and Let America Build.
44. U.S. Department of Energy. (April 2024). Queued Up: 2024 Edition, Characteristics of Power Plants Seeking Transmission Interconnection As of the End of 2023.
45. Number Analytics (17/04/2025). Top Private Sector Urban Practices for Fast Growth.
46. BNY Investments (27/01/2025). 2025 Infrastructure Outlook.
47. American Society of Civil Engineers (ASCE). (25/03/2025). 2025 Report Card for America’s Infrastructure.
48. OECD (01/02/2024). Inclusive infrastructure: Scaling-up local investment in the United States
49. American Society of Civil Engineers (ASCE). (25/03/2025). 2025 Report Card for America’s Infrastructure.