

KEY TAKEAWAYS
- Despite a weaker than expected second quarter gross domestic product (GDP) print, we continue to believe the economy is undergoing a somewhat typical handoff from the early- to mid-cycle.
- In recent decades, economic expansions have lengthened with recessions occurring less frequently. History, as well as supportive consumer and business fundamentals, suggest another elongated expansion could be on the cards.
- Equities have delivered solid performance through these expansions, with regular bouts of volatility serving as healthy catalysts to extend bull markets.
SHORTEST RECESSION ON RECORD ENDED LAST APRIL
Two weeks ago, the National Bureau of Economic Research (NBER) officially declared that a trough in economic activity had occurred in April 2020, making the two-month COVID-19 recession the shortest on record dating back to the mid-1800s. This announcement that the recession had come to an end likely came as little surprise to followers of the ClearBridge Anatomy of a Recession program, with the ClearBridge Recovery Dashboard flashing an overall green expansionary signal 14 months ago. Further, the ClearBridge Recession Risk Dashboard has been showing an overall green expansionary signal since it was reintroduced at the start of this year, with all 12 underlying indicators turning green two months ago. There are no changes to the dashboard for August.
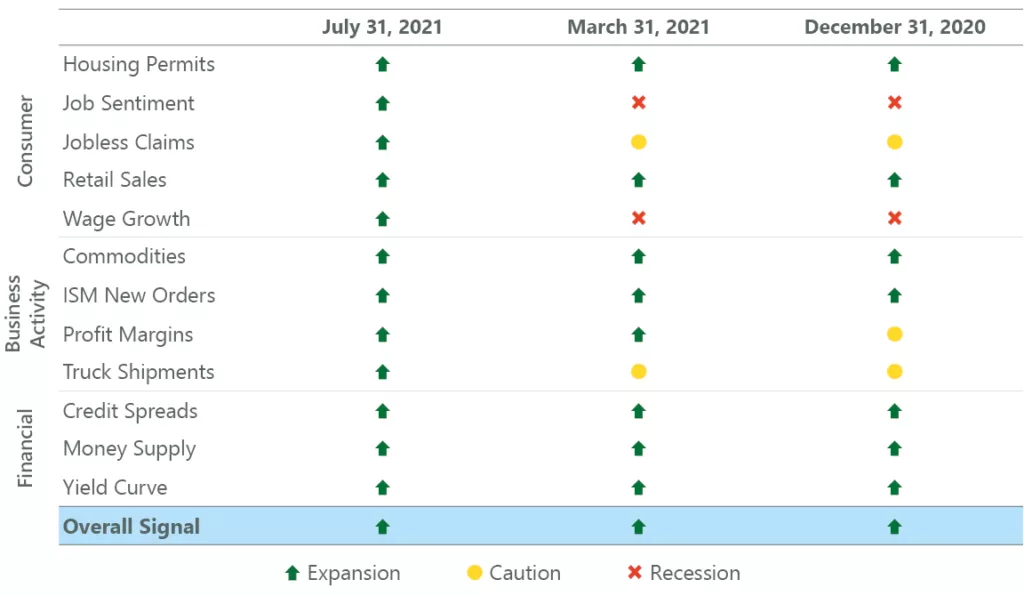
Source: ClearBridge Investments.
In previous months, we have mentioned the overall reading on the dashboard has been among the best in history. This strength has persisted, despite GDP “missing” expectations for the second quarter when the advance release came in at 6.5% vs. consensus of 8.4%. Economic activity in the second quarter was modestly held back by well understood supply chain issues as well as weaker government spending which tend to be less important considerations for equity investors. Further, supply issues which caused a formidable inventory drawdown and weakness in trade and housing should begin to ease in the second half. Importantly, 6.5% was the best quarter for economic activity in nearly 20 years (since the third quarter of 2003), leaving aside the outlier third quarter of 2020 when the initial reopening occurred.
While many economic indicators continue to show strength, the current environment likely represents peak economic and earnings growth as discussed previously. Although some market participants appear to be worried about an impending slowdown, we continue to believe the economy is undergoing a somewhat typical handoff from the early- to mid-cycle. This period often is accompanied by choppier equity markets as investors seek to ascertain the dominant themes of the next expansion. Even though these can only be known with the benefit of hindsight, a double-dip recession is clearly not on the horizon.
MODERN EXPANSIONS HAVE HAD STAYING POWER
Double-dip recessions – a second recession occurring within a year from the end of the prior one – are rare with just one example since World War II and three since the mid-1800s, according to the NBER. In recent decades, the economic expansions have lengthened with recessions occurring less frequently. The last four expansions, for example, have lasted 103 months on average (slightly over 8.5 years). In fact, three of the four longest (and four of the six longest) expansions in history have played out over the past four decades.
A similar pattern is evident when looking at the ClearBridge Recession Risk Dashboard, with 82 months on average (excluding the 1980 double-dip) between when the dashboard recovered to overall green levels following a recession and the start of the subsequent recovery. Further, a shift toward longer green periods relative to history has occurred in tandem with the elongated economic cycles of recent years. Perhaps more importantly, equity returns during these historical periods have averaged 7.5% on an annualized basis during the period between green and the next recession, and an even stronger 10.6% between green and the market peak that occurred prior to the recession.
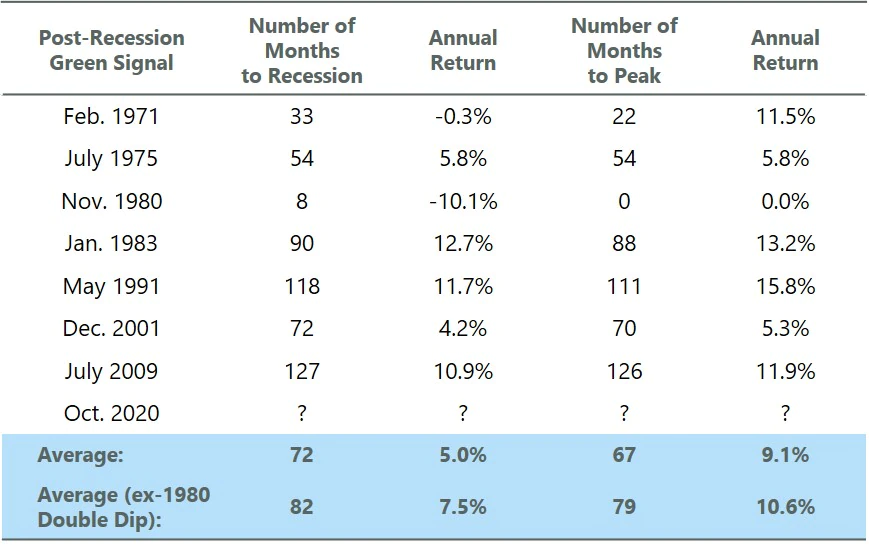
Annual returns are of the S&P 500 Index from the first post-recession green signal on the ClearBridge Recession Risk Dashboard to the next recession and from the first post-recession green signal to the S&P 500 peak. Source: National Bureau of Economic Research, Bloomberg, ClearBridge Investments.
While returns have historically been solid during economic expansions, markets have not been immune from volatility. There are meaningful corrections during any economic cycle. For example, the last bull market cycle witnessed three near-bear market corrections of 15-20% (2010, 2011, and 2018), two drawdowns between 10-15% (2016, 2018), and three additional pullbacks within 30 basis points of 10% (2011, 2012, 2015). Although some newer equity investors may shudder at the thought of enduring that type of choppiness again, these flushing out periods are healthy and an essential foundation for a fledgling bull market.
Given heightened volatility during the last three transitions from early-to mid-cycle in 1994, 2003, and 2011, a period of consolidation ahead would not be surprising. In retrospect, each of these periods proved great buying opportunities for long-term investors. Given today’s robust economic backdrop, built on the strength of healthy consumer and business balance sheets, we feel any correction would witness a similar outcome.
The ClearBridge Recession Risk Dashboard is a group of 12 indicators that examine the health of the U.S. economy and the likelihood of a downturn.
The ClearBridge Recovery Dashboard includes 9 leading economic, financial and market indicators that can provide information about the direction of the U.S. economy.
The S&P 500 Index is an unmanaged index of 500 stocks that is generally representative of the performance of larger companies in the U.S.
Gross Domestic Product (GDP) is an economic statistic which measures the market value of all final goods and services produced within a country in a given period of time.
Past performance is no guarantee of future results. Please note that an investor cannot invest directly in an index. Unmanaged index returns do not reflect any fees, expenses or sales charges.
Equity securities are subject to price fluctuation and possible loss of principal. Fixed-income securities involve interest rate, credit, inflation and reinvestment risks; and possible loss of principal. As interest rates rise, the value of fixed income securities falls. International investments are subject to special risks including currency fluctuations, social, economic and political uncertainties, which could increase volatility. These risks are magnified in emerging markets. Commodities and currencies contain heightened risk that include market, political, regulatory, and natural conditions and may not be suitable for all investors.
U.S. Treasuries are direct debt obligations issued and backed by the “full faith and credit” of the U.S. government. The U.S. government guarantees the principal and interest payments on U.S. Treasuries when the securities are held to maturity. Unlike U.S. Treasuries, debt securities issued by the federal agencies and instrumentalities and related investments may or may not be backed by the full faith and credit of the U.S. government. Even when the U.S. government guarantees principal and interest payments on securities, this guarantee does not apply to losses resulting from declines in the market value of these securities.