
Over the last 25 years, global high yield bonds have produced materially better risk-adjusted returns than equities. Jack Holmes, manager of Artemis’ high yield bond strategies, addresses some of the misconceptions about the market.
Risk-adjusted performance
As it reaches its 25th anniversary, the global high yield (GHY) market still faces many misconceptions that could be holding investors back from making an allocation.
Should it be treated in the same way as other bond and fixed income assets? Or should it be viewed as providing equity-like exposure? How volatile is it? Is the risk of default high given the uncertain economic outlook?
The benchmark index for GHY is the ICE Bank of America High Yield Index which was started 25 years ago, at a time of increased issuance in the US and globally to fund the wave of M&A – often by highly-leveraged companies – at the end of the last century.
Since then, investors have often focussed on the risk of default and viewed GHY as being higher risk than equities.
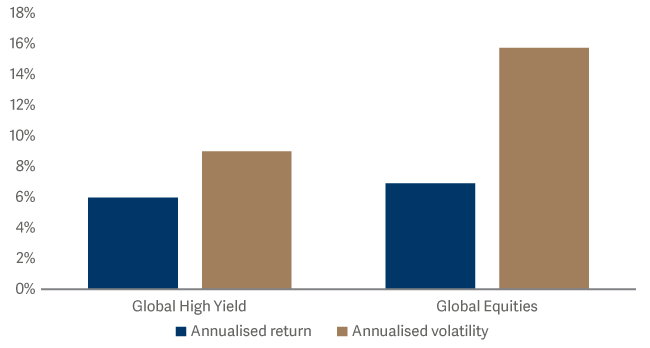
But global high yield exhibits materially better risk-adjusted returns than equities over long time periods. As the chart below indicates, since the global high yield index’s inception in 1998 the market has produced equity-like total returns with less than two thirds of the volatility.
High yield bonds vs. equities
Admittedly the last decade has seen high yield’s total returns lag equities, as the chart below indicates. However, we believe this could set up global high yield investors today for a potentially very interesting period of catch-up…
Rolling 5yr total returns – we know that GHY produces similar total returns to global equities over time, perhaps lagging equities over last decade provides an attractive entry point?
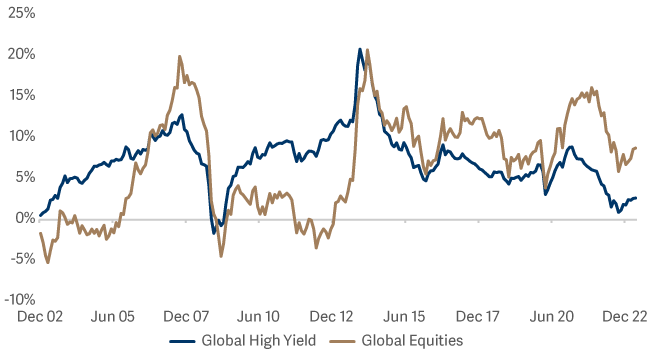
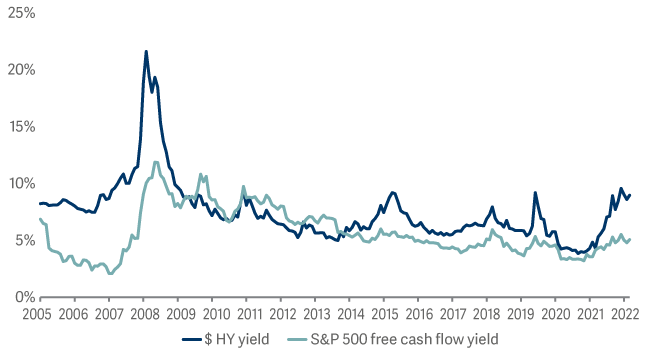
especially given the current level of relative valuations, based on the comparison of US HY vs. US equities where the available data is longer and deeper.
Yield attractive versus equities
What about the risk of default?
At current valuations, fully 50% of the high yield market would need to default over the next five years in order for an investor to break even1. This assumes a recovery rate of 40%, which is slightly below the historical average.
To put this 50% figure into some context – the average historical 5-year default rate since Moody’s data began in 1920 is 14.1%. The all-time maximum was 46.8% over 1930-1935.
The Global Financial Crisis peak level was 25.3%; the TMT bust, at the turn of this century, was 34.1%; and the Savings and Loan Crisis/early 90s recession was 34.3%.
In short, we believe valuations provide a cushion for returns exceeding any level of defaults seen through over 100 years of history.
Importantly though, there is little evidence this is justified.
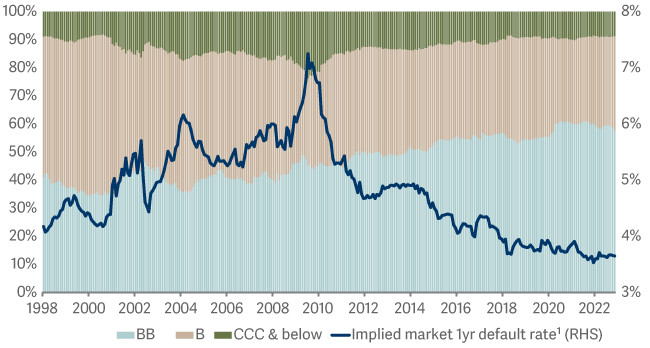
The global high yield market is higher quality than at any point since the index’s inception, as the chart below shows.
It is also a more diverse market, with very little exposure to potential ‘problem sectors’ as existed in the past. As an example, at the end of 1999, telecommunications made up 18.8% and media 17.1% of the GHY index – today the largest sector is energy, making up 12.7% of the index2.
Increasing quality
And the final point to make in relation to defaults is that there are currently a lot of bonds trading at lower cash prices.
This is important because most high yield bonds have recoveries, which have historically averaged around 44 cents on the dollar. If you start closer to the potential cash recovery, the downside to a default happening is lower than if the bond had been trading at 100.
Where does high yield fit in portfolio construction?
Lots of investors like the fundamental characteristics of high yield bonds but struggle to place it in a portfolio context for the reasons we have outlined.
If bonds are there to insulate you against drops in your equity portfolio, where do bonds that will be correlated with equities fit?
Perhaps the better way to think about the asset class is as equities, or alternatives. If we could get equity-like total returns, with two thirds of the volatility, and crucially much lower drawdowns in periods of significant weakness, could that be attractive as part of an equities/alternatives allocation?
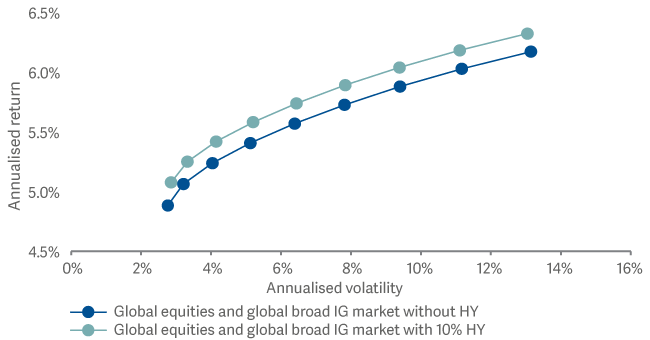
As the following chart demonstrates, over the past two decades, incorporating high yield into an existing simple investment-grade /government bonds and equity portfolio would have allowed investors to achieve higher levels of total return with lower levels of volatility. Given the characteristics and valuations described above, there are plenty of reasons to expect this benefit to continue.
With superior risk/reward characteristics
But how does high yield perform around recessions?
As referenced above, high yield tends to exhibit significantly lower levels of drawdown than equities in major drawdowns. This is significant – historically investors could reduce their exposure to underperformance ahead of major corrections by moving out of equities and into high yield.
It’s also worth reinforcing how much valuation premium is currently built up in the market. Yields were similar to today’s levels in October 2007. Over the following three years, while there was obviously significant volatility, the total return was +28.8% (global equities over the same period delivered -19.1%). And this was with a significantly worse level of credit quality than today, and with a much higher cash price (97 vs. 89 today). In other words, today’s valuations provide a lot of room for performance over the medium term.
Why Artemis global high yield?
Like in many asset classes, we believe taking an active approach in under-researched, smaller parts of the market offers the best opportunities. In order to do this, we focus on an area we call the “under-covered tail”.
This is the area away from the large issuers that all our index-centred peers focus on.
We believe that by hunting where others aren’t, we can find more attractive mispriced opportunities. And unlike our peers, when we find these opportunities, we back them on a scale that means we can generate meaningful outperformance from them.
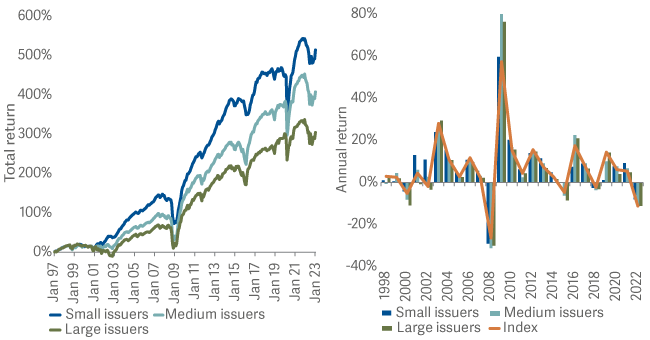
While the primary reason for focusing on this part of the market is that it is less efficient and so provides us with more scope as active managers, there’s also reasonable evidence that smaller issuers tend to outperform larger issuers.
The chart below demonstrates this long-term outperformance, but also shows that this long-term outperformance doesn’t come at the cost of underperformance in the weaker years.
Smaller issuers have tended to outperform over longer time periods, and with lower drawdowns
Artemis global high yield approaches the high-yield market in a unique way. It is a high-conviction strategy, which allows us to ignore the index and solely focus on selecting the most attractive high yield investments we can identify.
For investors looking for an attractive yield, particularly at current valuations, global high yield offers a very attractive option, with lower volatility than equities.
1Based on 31 May 2023 spread to worst of 526 bps, 5-year US Treasury yield of 3.75%, par-weighted coupon of 5.50%, constant default rate over 5 years, recovery rate of 40%.
2Bloomberg ICE Bank of America High Yield Index as at 31 December 1999 and 31 May 2023.
Important information
The intention of Artemis’ ‘investment insights’ articles is to present objective news, information, data and guidance on finance topics drawn from a diverse collection of sources. Content is not intended to provide tax, legal, insurance or investment advice and should not be construed as an offer to sell, a solicitation of an offer to buy, or a recommendation for any security or investment by Artemis or any third-party. Potential investors should consider the need for independent financial advice. Any research or analysis has been procured by Artemis for its own use and may be acted on in that connection. The contents of articles are based on sources of information believed to be reliable; however, save to the extent required by applicable law or regulations, no guarantee, warranty or representation is given as to its accuracy or completeness. Any forward-looking statements are based on Artemis’ current opinions, expectations and projections. Articles are provided to you only incidentally, and any opinions expressed are subject to change without notice. The source for all data is Artemis, unless stated otherwise. The value of an investment, and any income from it, can fall as well as rise as a result of market and currency fluctuations and you may not get back the amount originally invested.