A soft landing for the global economy looks increasingly unlikely. Which means riskier asset classes could see further declines.
Table of contents
- Asset allocation: end of the summer surge
- Equities regions and sectors: dialling up defensiveness
- Fixed income and currencies: in Treasuries we trust
- Global markets overview: a synchronised sell-off
- In brief
01 Asset allocation: end of the summer surge
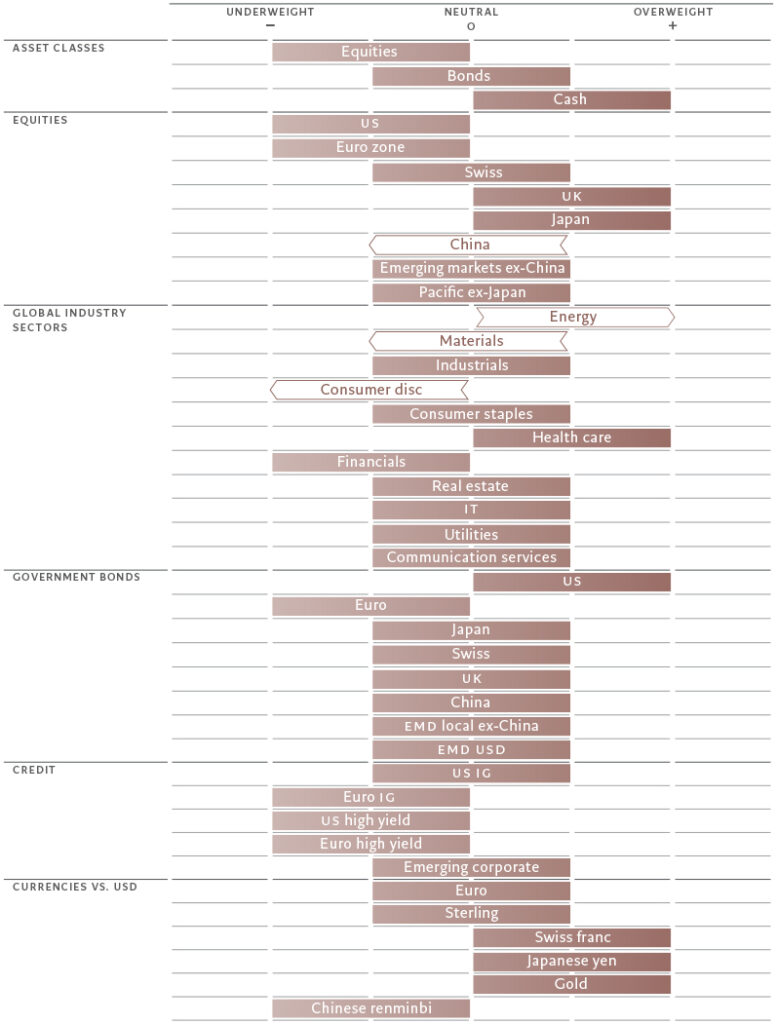
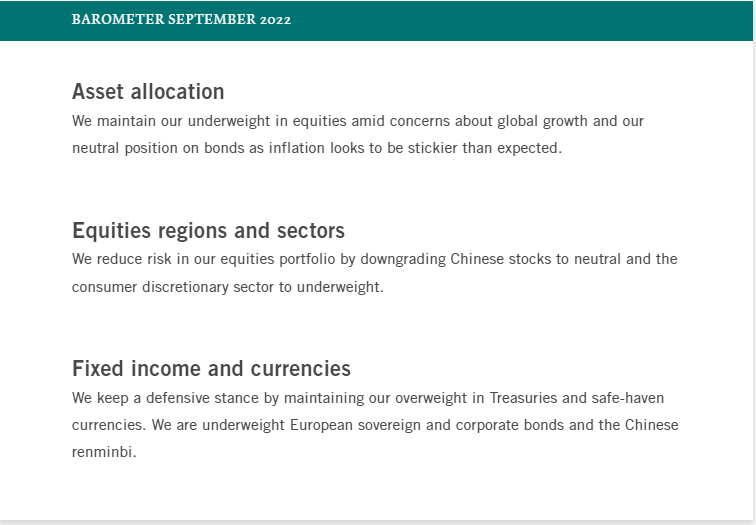
The surge in stock markets that accompanied the summer heatwave is, we believe, over. From here on in, conditions are likely to be much less friendly. As a result, we maintain our underweight stance on equities and our neutral position on bonds, balanced by an overweight in cash.
The summer rally came as falling oil prices boosted hopes the US Federal Reserve could engineer a soft landing for the US economy. Further lifting investor sentiment were data testifying to the US’s economic resilience.
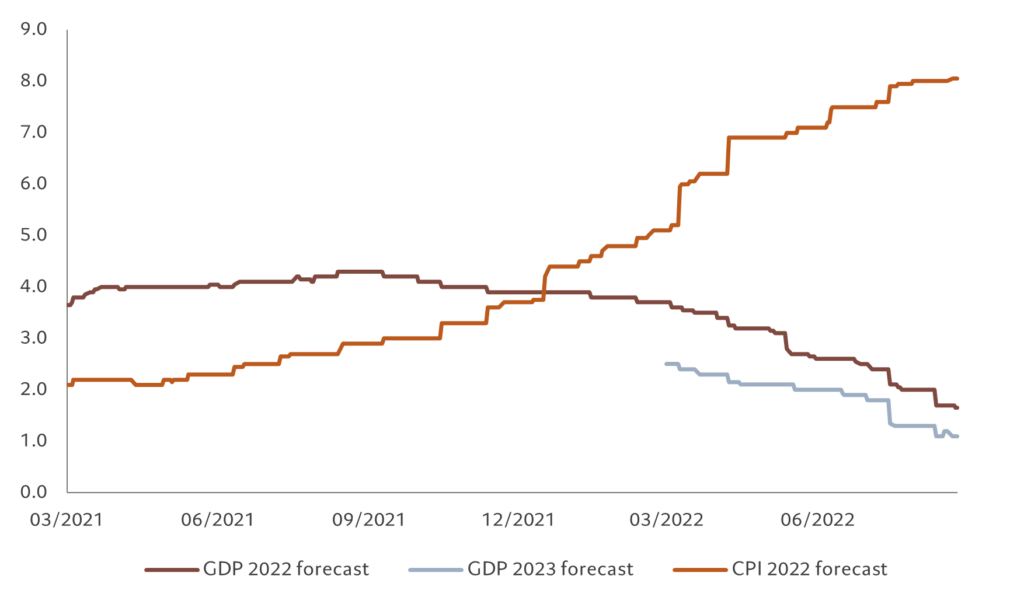
Yet there are reasons to believe the stock market recovery has run its course. Oil prices are rising again. And even if inflation has peaked, it is looking sticky. Business and consumer surveys, meanwhile, are turning gloomy even though central banks are likely to ignore these until they feed through to hard economic data. At the same time, valuation and sentiment indicators no longer offer compelling cases to hold riskier assets (see Fig. 2).
Fig. 1 – Monthly asset allocation grid
September 2022
To turn more positive on riskier assets, we’d need to see several developments unfold at more or less the same time.
First, a steeper yield curve. That would suggest strong economic growth down the line; it is also a prerequisite for bull markets. Second, a bottoming of downward revisions to corporate earnings forecasts and to leading economic indicators. Third, technical indicators giving unequivocal ‘oversold’ signals for equities, and cyclical stocks in particular. And finally – for bonds – that the currency monetary tightening cycle is sufficient to get inflation back to central banks’ targets.
Our business cycle indicators point to more inflation surprises and a sustained loss of momentum in economic growth indicators. We have again cut our global GDP forecast for the current year, to 2.5 per cent from 2.9 per cent, largely as a consequence of weakening US data.
We now expect the US economy to grow by just 1.6 per cent this year, from 3 per cent previously. Although leading indicators have been weakening across most regions and sectors, we anticipate both the euro zone and the US will narrowly avoid recession over the coming quarters. Indeed, US survey evidence and hard data increasingly look at odds with one another, with retail sales remaining resilient, unemployment at 50-year lows and residential investment as a percentage of GDP hitting new post-global financial crisis highs.
The euro zone economy outperformed during the first half of the year thanks to pent-up demand following the removal of Covid restrictions, but the latest numbers are less encouraging. The recent surge in European gas and electricity prices is a particular worry. The UK, meanwhile, is clearly sliding into a recession while inflation continues to rip higher, posing an intractable dilemma for the Bank of England. On the other hand, Japan remains a bright spot as do emerging economies, particularly in Latin America.
Fig. 2 – Higher inflation, lower growth
US real GDP and CPI forecasts (%)
Our liquidity scores remain negative, with conditions particularly tight in both the US and the UK. Developed market central banks are making policy more restrictive by both raising interest rates and through quantitative tightening (QT) measures that contract their balance sheets – our central bank liquidity gauges show their worst readings since at least 2007. We expect global QT of some USD1.5 trillion this year, equivalent to a 1 percentage point increase in interest rates, which would unwind half of Covid-era monetary stimulus. At the same time, the pace of private credit creation is starting to slow.
Our valuation scores show that following their rally, equities are again looking expensive, while bonds are cheap to fairly valued. For global stocks, year-ahead price-to-earnings ratios have risen by a lofty 15 per cent since mid-June, reducing their appeal. Another negative comes in the shape of corporate earnings, whose growth we believe is running out of steam; we forecast a below-consensus 2 per cent growth in profits for 2022, with risks on the downside if economic growth weakens further. Our valuation models favour emerging markets, materials, communications services, UK bonds, the Japanese yen and the euro and finds as particularly expensive commodities, US equities, utilities, euro zone index-lined bonds, Chinese bonds and the dollar.
Our technical indicators show that trend and sentiment signals for riskier assets have largely normalised, having been negative during the fist half of the year. Despite the summer rally, sentiment indicators are neutral with the exception of utilities and euro zone high yield bonds, which look overbought. Speculative positioning in S&P 500 stocks is close to a record short. But while surveys show continued bearishness, that’s declining, and flows into equity funds have turned positive again.
02 Equities regions and sectors: dialling up defensiveness
Equities might have enjoyed a summer respite, but autumn threatens more storm clouds. Tactically, we therefore believe it is prudent to further reduce exposure to some of the more cyclical areas of the equity market.
Chinese stocks look somewhat vulnerable. The latest consumption and investment data from China have both come out much weaker than expected. There are also tentative signs of a peak in export growth. Our Chinese leading index is now declining. And, perhaps more worryingly, there is no end in sight to the problems engulfing the property market. Although Chinese equities look very cheap according to our valuation analysis, we believe the risks are too high – at least in the short term – and the policy reaction has so far been insufficient to offset the underlying economic weakness. We therefore reduce China to neutral from overweight.
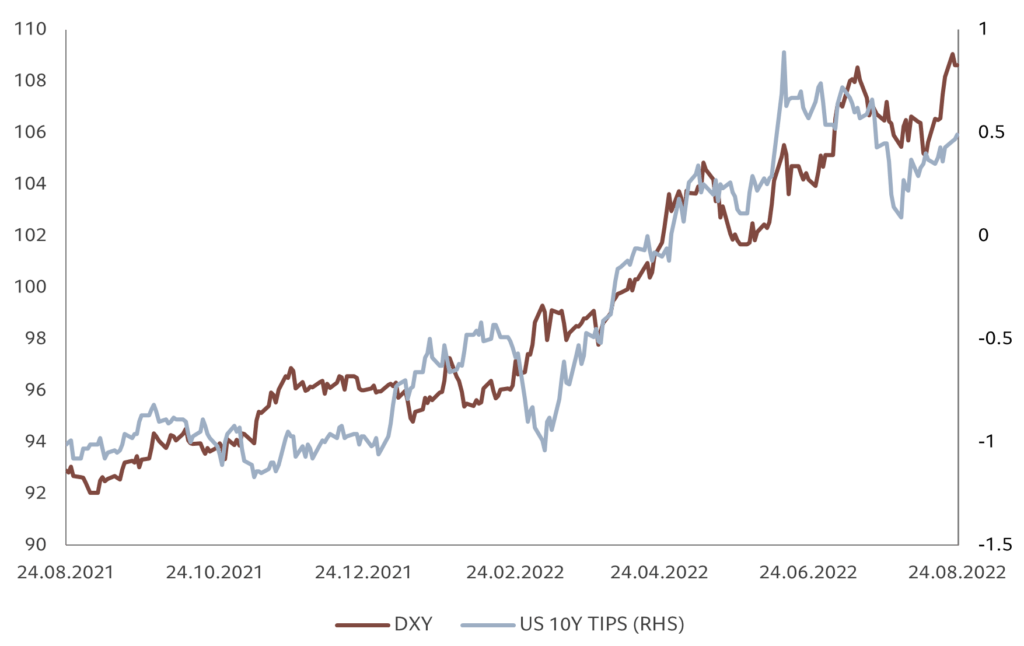
We also remain cautious on US and Europe. US is still by far the most expensive equity market and likely to suffer a deterioration in corporate earnings. According to our models, for US equities to generate positive returns over the next 12 months, US real GDP growth should be twice as high as economists currently forecast (2.4 per cent versus 1.2 per cent), or US 10-year TIPS yield should fall to 0 per cent – or a combination of both.
Europe, meanwhile, is at the brink of a recession thanks in large part to the effects of the Ukraine war on the region’s energy supplies.
We continue to like Japanese stocks – one of the few countries for which our macroeconomic score is positive and the fastest growing major developed economy on our forecasts for next year. The country benefits from a post-Covid pick-up in consumer demand, benign inflation dynamics and better energy security with policy support to restart nuclear plants. We also see some opportunities in UK equities, thanks to the market’s defensive characteristics and exposure to the energy sector. Furthermore, a weak sterling should boost the value of international earnings.
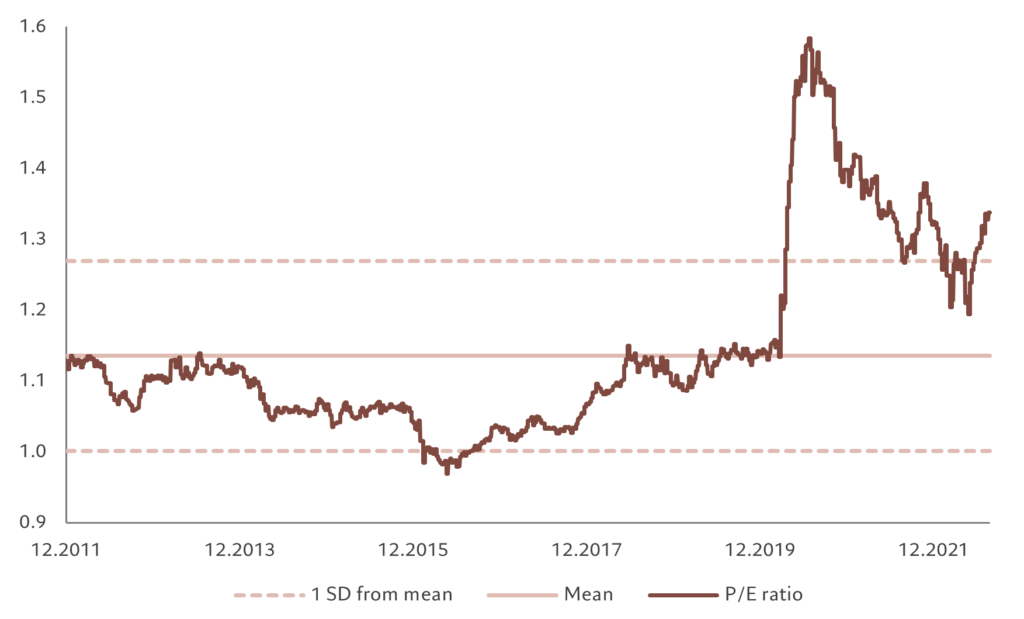
Fig. 3 – Looking expensive
Global consumer discretionary, 12m forward P/E ratio relative to market
At a sector level, we retain a preference for health care, which we believe offers quality defensive growth at reasonable value.
We downgrade consumer discretionary stocks to underweight after the recent rally (10 per cent outperformance since May relative to MSCI World). Valuation is not cheap (see Fig. 3), while real incomes are falling rapidly around the world, which could dampen consumer spending.
In the natural resources sphere, we switch our preference from materials to energy – downgrading the former to neutral and upgrading the latter to overweight. The move reflects materials being more vulnerable to a downturn in global growth and the lack of policy clarity in China, as well as the underlying momentum and technical indicators (with energy benefitting from positive medium-term trend signals).
03 Fixed income and currencies: in Treasuries we trust
A sharper-than-expected deceleration in US consumer price inflation has convinced investors that the Fed’s aggressive monetary tightening campaign is having the desired effect.
Markets are now discounting the possibility of US interest rates peaking at around 3.9 per cent in March – from 2.25-2.5 per cent currently- and being cut again by the end of next year.
The easing of the Fed’s tightening campaign explains why US Treasuries remain our biggest overweight position.
The asset class is also supported by its safe-haven status at a time when global leading indicators are declining further.
In contrast, we believe the economic fundamentals of the euro zone demand a more aggressive tightening campaign than the one currently in place. The European Central Bank surprised some investors with a 50-basis-point interest rate hike in July to rein in inflation, which is approaching double digit territory. However, the continued explosive rise in energy prices is likely to push the level of inflation in the bloc much higher. Markets are now pricing in a combined 135 basis point tightening for the rest of the year, 35 basis points more than last month.
Against this backdrop, we remain underweight European government bonds.
The region’s weakening economic outlook means we are also underweight European investment grade and high yield debt.
Fig. 4 – Lock step
US dollar trade weighted index and 10 year inflation-protected bond yields
We are neutral in emerging market sovereign and corporate debt. Emerging market central banks have on the whole better controlled inflation with pre-emptive rate hikes – leaving them well placed compared with their developed counterparts – and we’re more optimistic on the region’s economic outlook.
On currencies, we expect the dollar to hold up well in the near term, supported by interest rate hikes and the resilience of the US economy, although its valuation is already at a stretched level with the currency staying near a 20-year high against a basket of major currencies.
We remain underweight the Chinese renminbi. The currency has fallen to its weakest level against the dollar since September 2022 as interest rate differentials have narrowed in favour of the greenback, triggering capital outflows from China.
Data from the Institute of International Finance shows Chinese equities and debt suffered combined outflows of USD6.5 billion in July.
We maintain a long stance in the safe-haven yen and Swiss franc.
04 Global markets overview: a synchronised sell-off
August proved a month of two halves, as global equities reversed initial gains to finish firmly in the red. The latest weakness takes year-to-date losses for the MSCI World Index to 14 per cent in local currency terms.
Investors initially welcomed signs of a peak in US inflation, but optimism over the possibility of a soft landing for the world’s largest economy faded in the face of weak data – including on jobs – and a hawkish central bank. Fed Chair Jerome Powell said it would “take some time” to restore price stability and the process would “require a sustained period of below-trend growth”.
The S&P 500 finished the month 4 per cent lower (see Fig. 5). Equity markets in the euro zone, UK and Switzerland also lost ground.
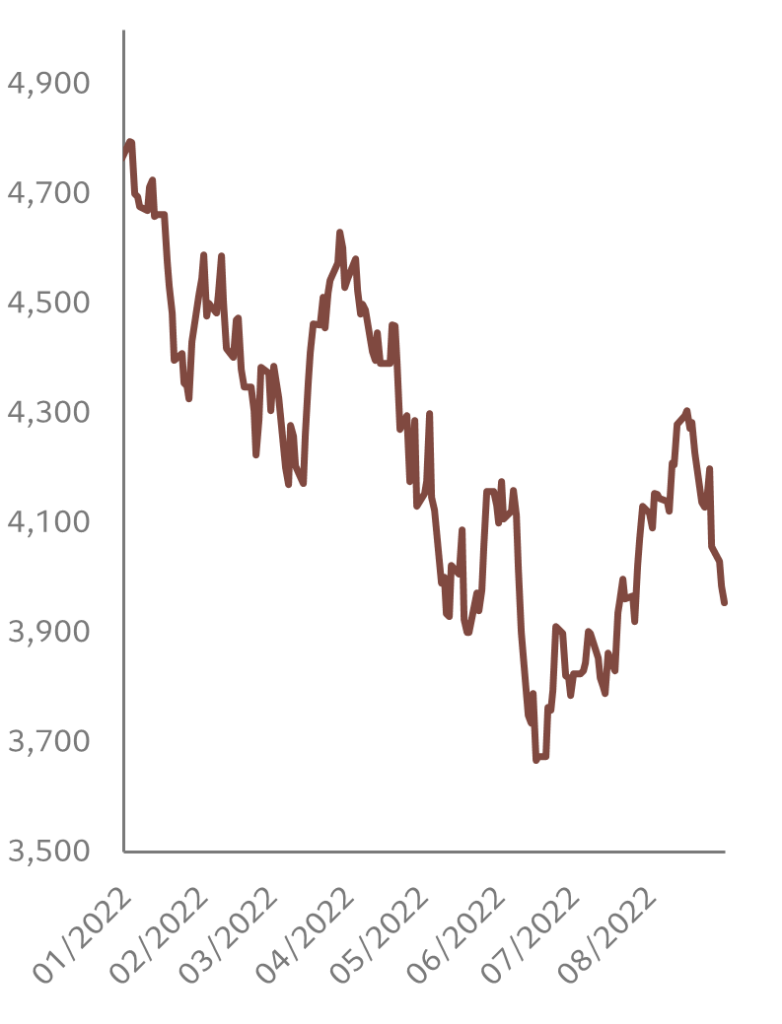
In contrast, emerging market stocks gained over 1 per cent in local currency terms, boosted by Latin America. Japan also managed a positive month.
Globally, losses were seen both for small and large cap stocks, as well as for both growth and value styles. Energy was the only sector which managed to post gains, despite a steep 12 per cent decline in oil prices.
The prospect of continued rate hikes also weighed on bond markets.
German Bund yields posted their biggest monthly increase in around three decades in the face of a new record high in euro zone inflation (which surged to 9.1 per cent year-on-year in August, according to preliminary data).
Yields on 2-year US Treasuries, meanwhile, scaled 15-year highs above 3.5 per cent, as markets moved to price in more interest rate hikes.
Weakness was also seen in developed market credit, across both investment grade and high yield.
The dollar enjoyed a strong month, hitting a two-decade high versus a trade-weighted basket of currencies. It flirted with parity versus the euro, and neared the psychologically key threshold of 140 Japanese yen – a level which some believe may lead to policymaker intervention.
05 In brief
Information, opinions and estimates contained in this document reflect a judgement at the original date of publication and are subject to risks and uncertainties that could cause actual results to differ materially from those presented herein.

