2022 has proven to be a particularly challenging year for investors across the world. The S&P 500 closed -18.51%1 down despite a relatively good fourth quarter. In that context, many investors could have found solace in the fact that their investment at least outperformed the market. Unfortunately, this would not have been the case for many of them. As highlighted semi-annually by the SPIVA scorecard, the majority of active managers underperform their benchmark over the medium to long term, and this is particularly true for US equities. In the US, 9.97%2 of funds outperformed the S&P 500 after fees over the last ten years, and 15.5% did so over the last five years. So, what could explain such poor results, and how could investors go about finding the diamond in the rough that will deliver this elusive outperformance?
Are markets too efficient?
One often-mentioned explanation for the difficulties of active managers is the increasing efficiency of markets across the world (and in the US in particular). However, academics have demonstrated once and again that systematically investing in factor portfolios would have outperformed the market over the long term. Investing in high-dividend stocks, high-quality stocks, or cheap stocks in a systematic manner should therefore give managers one of the keys to outperforming the market. It is worth noting that academic research has shown that the expected outperformance yielded by such approaches has not meaningfully decreased over time, with markets becoming more efficient. Of course, ‘systematic’ is the key word in this approach, and this is where active fund managers may be struggling.
The WisdomTree US Quality Dividend Growth UCITS ETF is a good example of how using this decade-long research can help to seek outperformance of the S&P 500. Our exchange-traded fund (ETF) has outperformed since its inception in June 2016 and in many periods since then, as highlighted in Figure 1 (Last 5Y, Last 3Y, in 2022…). One of the reasons for this historical success is that the ETF’s investment process is rooted in this academic literature and focuses on a systematic selection of a diversified basket of highly profitable companies with solid dividend-paying credentials, leaning heavily into the Quality and High Dividend factors.
Figure 1: Historical annualised outperformance of the WisdomTree US Quality Dividend Growth UCITS ETF versus the S&P 500

Source: WisdomTree, Bloomberg. Period from 07 June 2016 to 31 December 2022. Calculations are based on daily NAV in USD. The inception date for the WisdomTree US Quality Dividend Growth UCITS ETF is 07 June 2016. Performances over periods longer than a year are annualised.
Historical performance is not an indication of future performance and any investments may go down in value.
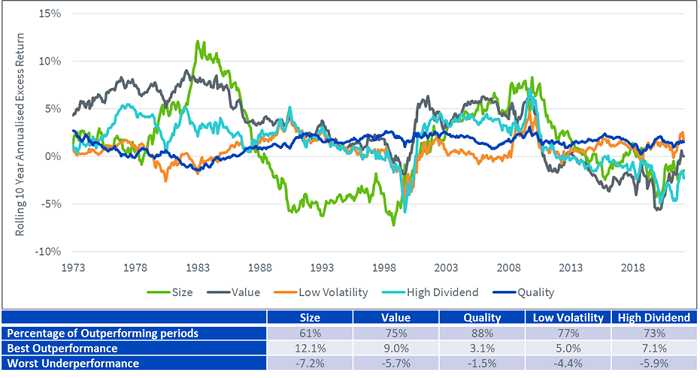
Of course, factors are not infallible, either. They do not outperform the market every single day or even every single year. While they tend to outperform over the long term, they also tend to ebb and flow between periods of relative under- and outperformance, depending on the cycle. But, strategically, some factors exhibit higher consistency than others. This is the case for Quality, which tends to outperform the most consistently with the lowest volatility, as shown in Figure 2.
Figure 2: Historically, Quality has delivered the most consistent outperformance over 10Y periods

Sources: WisdomTree, Ken French, data as of 31 July 2022 and represents the latest date of available data. Value: High 30% Book to Price portfolio. Size: Low 30% portfolio. Quality: High 30% portfolio. Low Vol: Low 20% portfolio. High Div: High 30 portfolio. Market: all CRSP firms incorporated in the U.S. and listed on the NYSE, AMEX or NASDAQ.
Historical performance is not an indication of future performance, and any investments may go down in value.
Over rolling 10-year periods, we can see that the Quality factor has exhibited outperformance most often (88% of the time versus the market) and has the smallest ‘worst underperformance’ number of all factors. It suggests that Quality is a true ‘all weather’ factor and that is the reason why WisdomTree decided to build its ‘core’ equity exposure ETF around that specific factor with the success I just described.
Is there a tech curse in the US?
Another often-mentioned explanation is that the US market is increasingly concentrated in large-cap tech stocks and that active managers suffer from underinvestment in those stocks. This would imply that it is not possible to outperform the S&P 500 without taking even bigger bets on tech stocks and, in particular, non-dividend-paying tech stocks like Amazon, Tesla, Meta or Alphabet. Extending this premise further, it is possible to wonder if only growth strategies have any chance to outperform in the US. Isn’t the incredible run of growth versus value over the last 10 years a proof of that?
The WisdomTree US Quality Dividend Growth UCITS ETF is a great example to show that neither of those things is, in fact, fundamentally true.
- First of all, the ETF focuses on dividend-paying, dividend-growing stocks meaning that it does not invest in companies that don’t pay a dividend. This means no investment in Amazon or the like. The average weight of Information Technology in the ETF since inception is 22.5%; a small underweight to the 22.8% of the S&P 500.
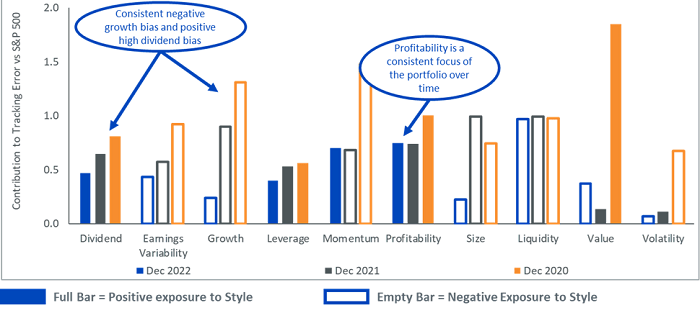
- Furthermore, the ETF has been consistently positively exposed to the High Dividend factor and negatively exposed to the Growth factor, as illustrated in Figure 3.
Both of these facts did not stop the ETF from outperforming its benchmark over the medium to long term, as illustrated in Figure 1.
Figure 3: Factor exposure of returns in excess of the S&P 500 over time

Source: WisdomTree, Bloomberg. Data as of 31 December 2022. Analysis is run on holdings of the ETF using PORT in Bloomberg. Factor definitions and calculations are explained in “US Equity Fundamental Factor Model” which is available in PORT Help in Bloomberg.
Historical performance is not an indication of future performance and any investments may go down in value.
Do highly profitable companies rule the market?
A final, intriguing explanation comes from a paper published in 2018 by Professor Hendrik Bessembinder3 that shows that only around 4% of stocks explain the totality of the excess wealth created by US equities between 1926 to 2016. In other words, a handful of the most successful companies create most of the outperformance. Looking back at who those companies are, we find Apple, Microsoft, General Electrics, IBM and so on. This, again, would speak to an approach where the focus is on companies that are growing, profitable, and high quality, leaning into the main principles that WisdomTree uses with its Quality Dividend Growth strategies.
What is the conclusion then?
Whatever the reason for the failings of active managers when it comes to delivering consistent outperformance, at WisdomTree, we believe that a robust, research-driven, systematic investment process focusing on high-quality stocks is the cornerstone of an equity portfolio and that it is the key to building resilient portfolios that can help investors build wealth over the long term and weather the inevitable storms along the way.
The ETF’s portfolio is constructed of around 300 dividend payers with the best-combined rank of Earnings Growth, Return on Equity and Return on Assets within an ESG-filtered universe of companies with sustainable dividend policies. Stocks are also risk-tested using a proprietary risk screen (Composite Risk Score), which uses Quality and Momentum metrics to rank companies and screen out the riskiest companies and potential value traps. Each company is then weighted based on its cash dividend paid (market capitalization x dividend yield), which introduces valuation discipline in the portfolio. Those steps, in combination, deliver a thoughtfully blended exposure to quality and high dividend. The outperforming track record of the WisdomTree US Quality Dividend Growth UCITS ETF, but also the WisdomTree Global Quality Dividend Growth UCITS ETF and the WisdomTree Eurozone Quality Dividend Growth UCITS ETF, over the last six and a half years is testament to that.
Looking forward to 2023, recession risk continues to hang over the market like the sword of Damocles. The International Monetary Fund (IMF) is warning of a recession in the US, a deep slowdown in Europe, and a drawn-out recession in the United Kingdom. While inflation has shown signs of easing, we expect central banks to remain hawkish around the globe as inflation is still very meaningfully above targets. With markets facing many of the same issues in 2023 that they faced in the second half of 2022, it looks like resilient investments that tilt to the Quality and High Dividend factors that have done particularly well in 2022 could continue to benefit.
Sources
1 Source: Bloomberg, WisdomTree. From 31 December 2021 to December 2022, in USD.
2 Source: S&P. SPIVA Report as of 30 June 2022.
3 Bessembinder, Hendrik (Hank), Do Stocks Outperform Treasury Bills? (28 May, 2018). Journal of Financial Economics (JFE), Forthcoming, Available at SSRN: https://ssrn.com/abstract=2900447 or http://dx.doi.org/10.2139/ssrn.2900447
Related blogs
+ Looking back at equity factors in Q4 with WisdomTree
+ When inflation is high, investors focus on high pricing power equities
+ What’s Hot: Endgame for central banks far from done
Related products
+ WisdomTree US Quality Dividend Growth UCITS ETF – USD Acc (DGRA/DGRG)
+ WisdomTree US Quality Dividend Growth UCITS ETF – USD (DGRW/DGRP)
+ WisdomTree Eurozone Quality Dividend Growth UCITS ETF – EUR Acc (EGRA/EGRG)
+ WisdomTree Eurozone Quality Dividend Growth UCITS ETF – EUR (EGRW/EGRP)
+ WisdomTree Global Quality Dividend Growth UCITS ETF – USD Acc (GGRA/GGRG)
+ WisdomTree Global Quality Dividend Growth UCITS ETF – USD (GGRW/GGRP)

