Inflexible market regimes tend toward fragility and often break with large and unintended consequences. Trading Japanese Government bonds has been a sleepy “widow-maker” for decades; we consider the potential range of repercussions of a shift in the Bank of Japan’s policy.
Yoga, it’s not for everyone. While spiritual enlightenment has so far eluded me, semi-regular practises have so far succeeded in keeping my lower back in working order. It seems that a few child’s poses here and chaturangas there provides the tonic for many hours spent rooted to a desk. As the mantra goes: “what doesn’t bend, breaks”.
As the yoga teacher repeated this line, my thoughts wandered to financial markets (I must have not been in much of a meditative state that morning). How many times have we seen inflexible policy regimes become fragile and break with spectacular effect? Even in the discomfort of a dolphin pose – think half plank, half handstand – it wasn’t hard to think of half a dozen.
It is of course the downfall of fixed-exchange rate regimes that have garnered the most attention in financial history books. The end of the gold standard completely re-shaped the global economy. Even isolated collapses of individual currency pegs have been felt well beyond the trading floor. For instance, it was the 1997 collapse of the Thai baht peg that spawned the Asian Financial Crisis. And I remember all too well how the sudden revaluation of the Swiss franc in January 2015 immediately added 20% to the cost of an overseas trip to the Alps.
The capping and uncapping of bond yields
This is not a paper however about yoga, nor the cost of living in Zurich, nor even the benefits of hedging your currency exposure. Getting to the point, similar principles apply to the bond market. In fact, in practical terms it is easier for central banks to cap or control bond yields than it is exchange rates. While fighting speculators in currency markets requires accumulating a large war chest of reserves, central banks print their own currency so can in theory buy unlimited amounts of bonds denominated in that currency.
But when these efforts run counter to the prevailing economic landscape or run into political issues, the rigidity in these policies becomes a source of fragility. These two ingredients are the bond market equivalent of attempting a downward dog with a pulled hamstring.
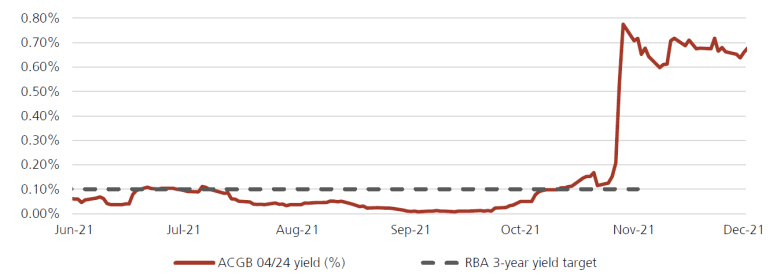
Chart 1: Australia 3-year government bond yield versus its target
The unceremonious end to yield curve control (YCC) in Australia

Chart 1: Chart depicting 3-year Australian government bond yield versus RBA target
Again, this is something your Sydney-based correspondent has witnessed first-hand. The Reserve Bank of Australia (RBA) initiated a three-year bond yield target in March 2020 to keep borrowing costs tethered close to zero amid worries about the potential depressionary impact of a once-in-a-century pandemic. However, as the inflationary reality of the COVID-19 recovery started to reveal itself, the yield target was tested to breaking point. The targeted 3-year yield chaotically climbed 65 bps in a week before the RBA unceremoniously dumped the policy in November 2021 (Chart 1).
Looking further back into the annals of history, a similar system of yield caps operated in the US from 1942 to 1951. In the latter years there was considerable tension between the Treasury, which wanted to finance the government’s large deficits at a low cost, and the US Federal Reserve, which was concerned about high inflation. The advent of the Korean war, which required greater defence spending leading to even higher rates of inflation, ultimately put paid to the yield caps. If this sounds familiar, it is meant to.
Bank of Japan YCC policy is under pressure
Which brings us to present-day Japan. At first glance, the inertia of Japanese Government bonds (JGBs) doesn’t look like a source of potential excitement for investors. 10-year yields have risen just 18 bps year-to-date, compared with the 148 bps rise in US Treasury equivalents1. It hasn’t just been this year. The average annual range for JGBs in the past five years has been just 20 bps.
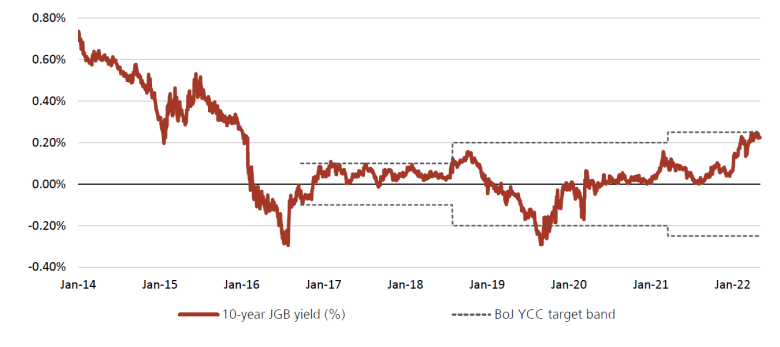
Chart 2: 10-year Japanese Government bond yield and target range
The BoJ has pinned JGBs into tight ranges

Chart 2: Chart depicting 10 year Japanese Government bond yield and YCC target range
Of course, this reflects the successful operation of the Bank of Japan’s YCC (yield curve control) policy, which has been in place since 2016 and currently does not permit the 10-year yield to deviate beyond +/-0.25% (Chart 2).
JGBs have been the poster child of lower-for-longer rates and a “widowmaker” trade for short sellers for many years. Many of the structural reasons for this still apply. This includes unfavorable demographics and the persistence of debt overhangs dating all the way back to the asset price crash of the late-80s, as well as decades of near-zero wages growth that will be difficult to reverse.
So nothing to see here? Not quite. Beneath the surface there are signs that pressure is starting to build on the central bank. Of the ingredients we listed earlier for inflexible policies breaking, both are becoming evident.
First, the economic cycle has shifted. Core inflation is due to reach the central bank’s 2% target for the first time since 2008. The BoJ deems that this will be temporary. It might well be but it is worth considering that at the moment there are powerful global forces driving inflation and not many forecasters around the world have had success in making the “transitory” call.
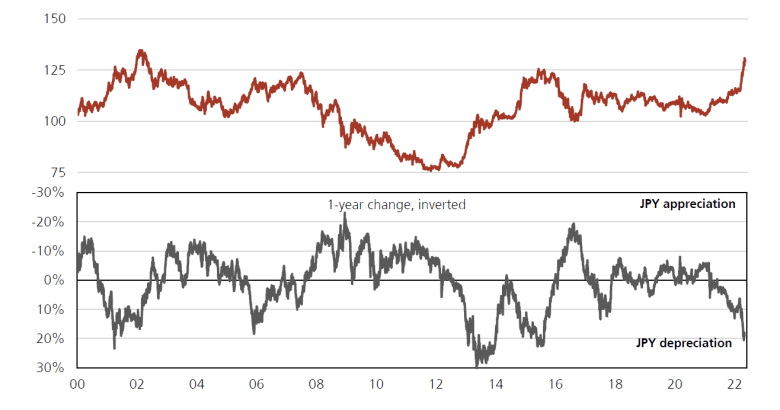
Second, there are rumblings of political discontent. The government is worried about the impact on the purchasing power of consumers and importers from the freefalling yen, which has lost 20% of its value versus the US dollar over the past year (Chart 3). The BoJ doesn’t appear to share these concerns.
Chart 3: USD/JPY currency rate
Yen weakness adds pressure to the BoJ’s YCC

Chart 3: Graphs depicting USD/JPY current rate over 1 year
The challenge is that there is a vicious feedback loop at play. The longer the BoJ stands as the lone dove in global central banking circles, the more the Japanese yen weakens and the more that inflation is likely to rise and political worries build. In our view, this is not sustainable. Sure enough, yields are butting up against the YCC ceiling while the BoJ accumulated JPY 9.3 trillion of debt in April and is in the market every day offering to buy unlimited JGBs at a fixed rate of +0.25%.
Japanification on pause
So the inflexible YCC looks fragile. What happens if it breaks? We believe the immediate and obvious ramification is that 10-year yields could jump higher, making it prudent for global mandates to take an underweight position in JGBs.
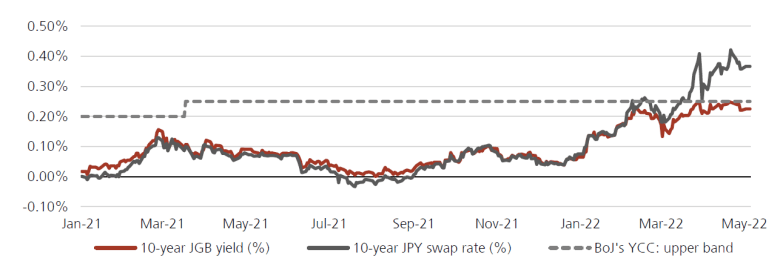
Equivalent Japanese yen swap rates, which are not subject to YCC, can help to quantify the potential scale of the sell-off. As chart 4 shows these yielded as high as 0.45% in April this year. Yet, a shift in YCC policy would also be a hawkish signal meaning that 10-year JGB yields are likely to comfortably overshoot these levels if permitted.
Chart 4: 10-year Japanese bond and swap rates
Swap rates show that JGB yields should jump higher, if permitted

Chart 4: Graph depicting 10-year Japanese bond and swap rates
More important for global allocators is what this could mean for the rest of the world. Japan runs a sizeable current account surplus which means its financial institutions have growing pools of capital to export. A large chunk of this has historically found its way into other bond markets, such as the US or Europe. This is part of the “Japanification” of global fixed income markets that we have been experiencing for many years. Low JGB yields, supported by negative interest rate policy and YCC have had the effect of pinning down global yield curves as Japanese investors hunt overseas for yield.
Inhale, exhale. Coming back to the present moment: could a BoJ policy shift see the same dynamics play out in reverse? The bad news for asset holders first: Japanese money has already been flowing out of global bond markets. That includes net outflows from US Treasuries for the past four months despite the highest outright yields on offer since 2018. Recently published investment intentions of Japanese life insurers cite higher outright ultra-long JGB yields (30-year JGBs are permitted to fluctuate more freely and currently yield 1%2) and increased currency hedging costs as some reasons behind the reduced inclination to invest overseas. The absence of Japanese investors “buying the dip” is surely making the bond sell-off worse.
There is however good news: any adjustment to the central bank’s YCC policy would likely reflect cyclical dynamics – a weaker yen and higher imported inflation. As we have already pointed out, the underlying reasons for low JGB yields, such as debt and demographics, are more structural. Over the longer-term, global bonds are likely to retain their allure to Japanese investors.
“Japanification” might be on pause but it is too early to say it is in reverse.
You can find out more about our fixed income offering here.
2 Source: Bloomberg, as of 5 May 2022.

