
Equities and commodities are both cyclical assets. However, equities tend to lead the economic cycle while commodities tend to lag. We expect commodities to follow equities and rebound as we enter the next phase of the economic cycle.
In our previous blog, we focused on commodities’ diversification superpowers. In this blog, we want to look at the behaviour of commodities across the business cycle.
Analysis shows that broad commodities, while cyclical, complement other cyclical assets, like equities, very well across the business cycle:
- broad commodities tend to resist pretty well in the early phase of a recession, a period where equities suffer the most
- they also tend to do well in the late part of an economic expansion when equities usually fail to find their second wind
Cyclical asset performance in the post-COVID-19 era
With the support of tremendous fiscal and monetary support, most cyclical assets were rallying by mid-2020. While the equity rally came to an end by the close of 2021, commodities kept going until the middle of 2022. Commodities rose for longer in part due to the Ukraine war, which drove commodity-specific shocks (primarily in energy and agriculture), but also because commodities have traditionally been a late-cycle performer. All cyclical assets have come under pressure from developed country central banks tightening monetary policy and worries about the implications for economic growth. By October 2022, equity benchmarks like the S&P500 and MSCI ACWI had bottomed out and have generally been rising since. Commodities, on the other hand, have continued to decline since October 2022, once again highlighting its cycle is somewhat different to equities. However, that recent rally in equities maybe a ‘lead-indicator’ for a rebound in commodities.
Commodities benefit from economic expansions
Intuitively, it feels like commodities should benefit from a positive economic environment. When the economy grows, it needs base materials to do so. Metals are required to build new homes, new factories, new infrastructure, new cars etc. More energy is consumed to move goods and people around. So, overall, there is a logic to commodities behaving like a cyclical asset. Conversely, as an economy cools and demand for these goods decline, so should commodity demand.
To fully assess the relationship of commodities with the business cycle, we turn to the National Bureau of Economic Research (NBER) Business Cycle Dating Committee, which maintains a chronology of US business cycles. The chronology identifies the dates of peaks and troughs that frame economic recessions and expansions. By comparing the performance of different assets in those recession and expansion periods, it is possible to assess their cyclicality. Figure 1 shows that equities have gained on average 0.86% per month in periods of expansion. This is the largest performance among the asset classes tested. They are followed by commodities (+0.80%), high yield bonds (+0.56%), and corporate bonds (+0.35%). In periods of recession, high yield bonds (+0.15%) and equities (+0.36%) have performed less strongly. On the other side of the spectrum, US Treasuries and corporate bonds performed strongly (0.88% and 0.87%, respectively). Equities, commodities, and high yield bonds are cyclical assets, with equities and commodities being the strongest.
Figure 1: Performance of various asset classes in periods of economic expansion and recession
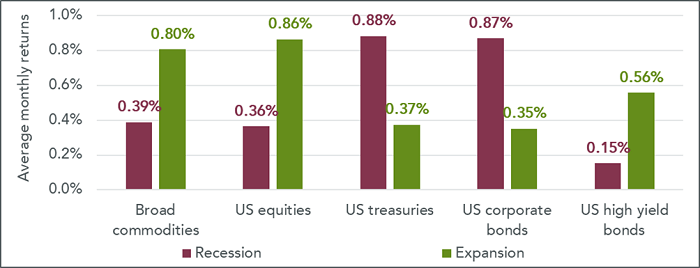
Source: WisdomTree, Bloomberg, S&P. From January 1960 to January 2023. Calculations are based on monthly returns in USD. Broad commodities (Bloomberg commodity total return index) and US Equities (S&P 500 gross total return index) data started in Jan 1960. US treasuries (Bloomberg US treasury total return unhedged USD index) and US corporate bonds (Bloomberg US corporate total return unhedged USD index) data started in Jan 1973. US high yield bonds (Bloomberg US corporate high yield total return unhedged USD index) data started in July 1983. Expansion and Recession phases are defined using the NBER website.
Historical performance is not an indication of future performance and any investments may go down in value.
A surprisingly robust asset in early recessions
While logical, this cyclicality may seem difficult to reconcile with the low correlation between commodities and equities. Equities are also very cyclical, so how can two cyclical assets be so uncorrelated?
On average, in all the months since the 1960s where US equities have lost more than -5%, commodities have lost -0.68%1. In all the months where US equities gained more than 5%, commodities gained 1.18%1. So, while commodities are cyclical, that is, they tend to lose and gain broadly at the same time as equities, the amplitude of such gains is significantly more muted. This supports our decorrelation hypothesis. It appears that, while commodities and equities tend to gain during the expansion phase of the business cycle, they may not gain at the same time, that is, during the same part of the cycle.
Figure 2 refines the analysis by splitting expansion and recession periods into two parts of equal duration. Through this lens, the results are pretty different. Equities and high yield bonds appear to behave very similarly:
- they suffer the most from the early recession part of the cycle but rebound the strongest in the late part of that recession
- while they benefit from the expansion part of the cycle, they rise faster in the early part of that expansion
On the contrary, commodities
- tend to hold up well in the early phase of a recession, posting on average a positive performance of 0.54% (vs -1.27% for equities)
- suffer more in the late phase of a recession and trail both equities and high yield bonds
- perform better in the second half of the expansion period, contrary to equities that prefer the first half – commodities are the strongest performers among all the asset classes in that late part of the expansion cycle
So, overall, while commodities are a cyclical asset, their behaviour is very decorrelated to equities or high yield bonds. They offer great diversification in early recession and late expansion phases when other cyclical assets (equities, high yield bonds) struggle.
Figure 2: Performance of equities and commodities across different parts of the business cycle
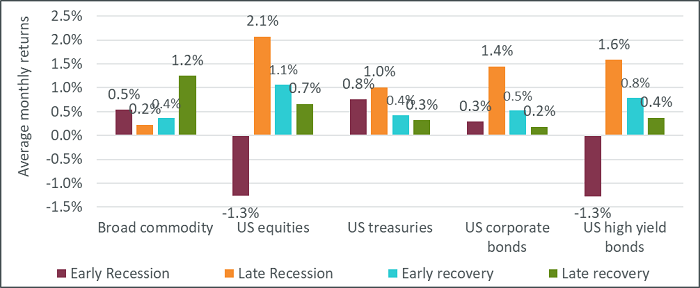
Source: WisdomTree, Bloomberg, S&P. From January 1960 to January 2023. Calculations are based on monthly returns in USD. Broad commodities (Bloomberg commodity total return index) and US Equities (S&P 500 gross total return index) data started in Jan 1960. US treasuries (Bloomberg US treasury total return unhedged USD index) and US corporate bonds (Bloomberg US corporate total return unhedged USD index) data started in Jan 1973. US high yield bonds (Bloomberg US corporate high yield total return unhedged USD index) data started in July 1983 Expansion and Recession phases are defined using the NBER website. To define early and late expansion/recession, the periods are split in half time-wise.
Historical performance is not an indication of future performance and any investments may go down in value.
A turn in the economic cycle?
While the NBER Business Cycle Dating Committee has not declared the US economy to have been in a recession in 2022 (or 2023), OECD composite lead indicators2 and Purchasing Manager Indices (PMIs)3 had clearly peaked in 2022. Composite lead indicator declines are decelerating (see Figure 3) and the latest PMI manufacturing reading (February 2023) reached a level consistent with activity no longer contracting. Moreover, markets are now pricing in an end to the interest rate tightening cycle within months for the US4 and within a couple of quarters for the Euro Area5. A potential turn in the economic cycle has already proven positive for equities. If history is any guide, equity performance may soften later in the cycle, but commodity performance will then accelerate.
Figure 3: Composite lead indicator and commodities
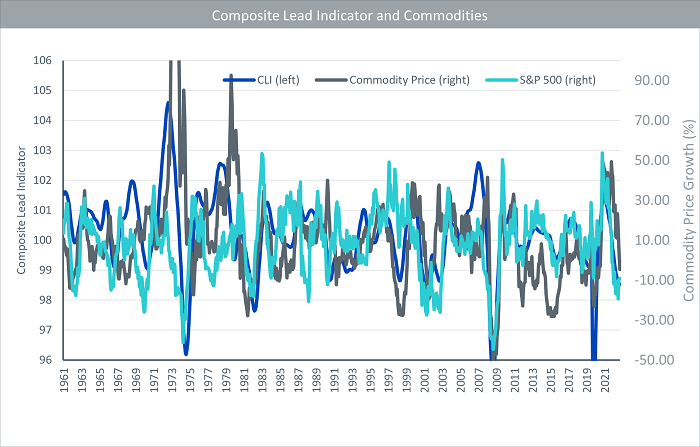
Source: WisdomTree, Bloomberg, OECD. June 1961 to February 2023. Commodity price based on Bloomberg Commodity Index. The composite leading indicator (CLI) is designed to provide early signals of turning points in business cycles showing fluctuation of the economic activity around its long term potential level. CLIs show short-term economic movements in qualitative rather than quantitative terms. CLI is amplitude adjusted, Long-term average = 100.
Historical performance is not an indication of future performance and any investments may go down in value.
We also take the view that there are some unique tailwinds behind certain segments of commodities that could propel them for years to come. For example, the energy transition to lower-carbon energy sources will likely be very metal positive (given their use in developing renewable and electrification infrastructure and battery technology). Also, a renewed interest in building infrastructure in the US and Europe could benefit commodity demand.
An excellent diversifier and a strong complement to equities across the business cycle are only two of the many advantages broad commodities can bring to a portfolio. The next item on the list is broad commodities as a powerful inflation hedge.
Sources
1 Source: WisdomTree, Bloomberg, S&P. From January 1960 to January 2023. Calculations are based on monthly returns in USD. Broad commodities (Bloomberg commodity total return index) and US Equities (S&P 500 gross total return index) data started in Jan 1960. Historical performance is not an indication of future performance and any investments may go down in value.
2 The OECD system of Composite Leading Indicators (CLIs) is designed to provide early signals of turning points in business cycles: https://www.oecd.org/sdd/compositeleadingindicatorsclifrequentlyaskedquestionsfaqs.htm
3 PMIs are a survey-based economic indicator designed to provide a timely insight into business conditions.
4 Fed Fund Futures are pricing the last hike from the Federal Reserve in May 2023 (Source: Bloomberg 23/03/2023)
5 Overnight Interest Rate Swaps are pricing the last hike from the European Central Bank in September 2023 (Source: Bloomberg 23/03/2023)