

The incredible repricing across fixed income this year has left many investors, including ourselves, pondering whether this is a good entry point.
Firstly, outright investment grade yields do look cheap over a 10-year period, even when considering the brief blowout in spreads in March 2020 when the world essentially went into lockdown. While yield is typically a good indicator of annualised return potential, given we’re looking at a period in which yields have been suppressed by loose monetary policy, yield alone fails to paint the full picture as we enter a phase of higher rates and the withdrawal of central bank asset purchases. Therefore to gauge value within investment grade credit, a product which tends to trade on spread rather than price, we must examine where credit spreads are relative to history.
ICE BofA BBB Sterling Corporate Index, 2001-present
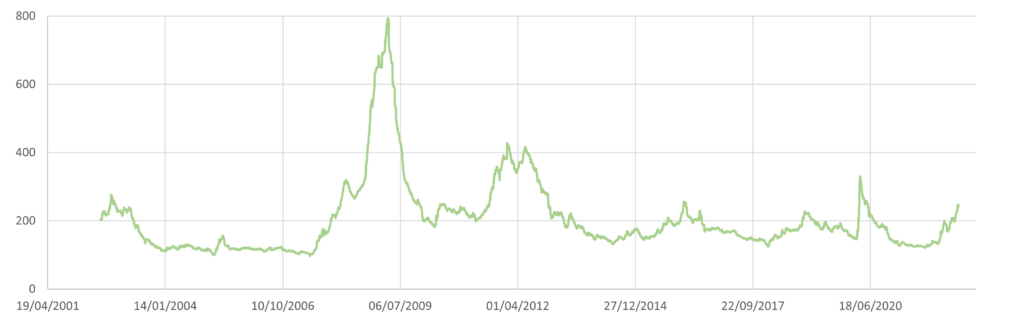
Source: Bloomberg, ICE BofA Indices
The chart showing BBB sterling corporate bond spreads above covers four distinct periods of market stress and subsequent recession; the dot-com bubble, the global financial crisis, the Eurozone sovereign crisis and the COVID-19 pandemic. Which of these periods is the best comparison for today’s environment?
The arrival of the pandemic in March 2020, which forced the world into lockdown and left previously successful businesses genuinely questioning whether they would ever make money again, triggered an aggressive move across financial markets. Rationally, there was a flight to safety and cash was a highly sought-after commodity as investors feared and faced redemptions. However, the market reaction and widening of credit spreads proved short-lived as ultra-loose monetary and fiscal policy on a global scale supported asset prices and spreads were very quick to retrace.
The global financial crisis was a systemic failure of the global banking system. In its early stages, the market genuinely doubted if many large, profitable investment grade companies such as Vodafone and Enel could refinance their senior bonds; hence why we still see some near double-digit coupons on outstanding senior bonds today. Liquidity totally dried up, the bond market was completely dysfunctional and investment grade spreads reached somewhat obscene levels. Since then banking regulations have been tightened and rewritten, banks are now incredibly well capitalised, and even extreme stress testing shows their resilience should we enter a period of uncertainty.
The sovereign debt crisis arguably came as a consequence of the global financial crisis, as certain Eurozone countries’ deficits ballooned to unsustainable levels to support their banks and jobless citizens, leaving them over-levered and suffering from poor growth. Up until this point the market essentially viewed Greek government debt as akin to German debt; this rapidly changed and led to Greece’s inability to roll or repay its debts, which ultimately triggered the sovereign crisis. During this period, with central banks themselves in crisis, they were unable to support their economies. In many ways this is not dissimilar to the situation central banks may be faced with today in the short term, as weakening economies may demand monetary easing but the battle with inflation supersedes, leaving policymakers’ hands tied and locked in to tightening in the face of recession. The comparison to the sovereign crisis may seem like a stretch, and it is by no means a perfect one, but certain mechanics are similar and we believe this represents a worst case scenario worth considering.
While we see similarities to the sovereign crisis, we don’t believe there is any read across from the global financial crisis or the COVID-19 pandemic – today’s situation isn’t a banking crisis and nor is it a pandemic, though clearly we are still suffering some of its effects.
The dot-com bubble, however, did exhibit similar characteristics to the period we have just been through. Inflated tech stocks, high retail involvement in the market, initial public offerings (IPOs) at staggering valuations where prices collapsed as soon as the market turned (similar to Peloton and many others today), and market rallies which could only be explained by “too much cash in the system” rather than fundamentals, all feel rather familiar. While the current market downturn does not exactly mirror the dot-com period, we believe it is a reasonable comparison for investment grade spreads and importantly it is a period before quantitative easing (QE) began distorting the credit market.
Taking the dot-com period of 2000-2003 as a first comparison (unfortunately we don’t have the data before 2002 but as the chart shows the real spike in spreads came in May 2002), sterling investment grade spreads reached a high of 276bp and spent less than two months above 240bp before rallying to inside 200bp within eight or nine months of hitting their wides. The same index is currently at 242bp, near its year-to-date high of 247bp (the low was 121bp in September 2021), which suggests a further 34bp of widening is possible based on the dot-com period.
If we look at the sovereign crisis as a worst case scenario, spreads in that period widened to 425bp from a low of around 200bp. A widening of 225bp from this year’s lows would take spreads to 346bp, suggesting a further 104bp of widening. However, given the higher absolute starting level of spreads in this period due to the overhang from the global financial crisis, relative widening may be a better gauge. Spreads widened 112.5% from their lows, which in today’s market would suggest a further 14bp of widening from 242bp to around 260bp. The three scenarios presented here are fairly divergent, and again we believe looking at the sovereign crisis in absolute terms represents a worst case scenario. However, taking an average of all three results, a widening of 51bp is probably a prudent gauge of the scale of widening we potentially have to come, though ultimately the fact that this is not a financial crisis means we see a limit on how bad things can really get.
So how might this impact returns?
While the above scenarios imply further spread widening is possible, high breakeven bonds (breakeven being the amount yields need to rise before carry is wiped out by capital losses) can give a portfolio significant protection. The BBB index used in the chart currently has a yield of 4.55% and a duration of 6.53 years, meaning the yield can increase by up to 0.81% before the return over a 12-month holding period from today turns negative. A spread widening of 51bp, from our average case, still results in a positive return over one year. Breakevens are even better at the front end of credit curves; an equivalent 1-5 year BBB Sterling Corporate index has a yield of 4.21% with a duration of 1.84 years, which gives a breakeven yield of 8.69%, meaning yields can increase a further 4.48% before annual returns turn negative. So even in our absolute worst case scenario where spreads widen by a sovereign crisis amount (104bp) annual returns are still positive. This is a powerful example of the protection that pull-to-par offers investors at the front end of the yield curve.
Ultimately we may or may not be near the wides in credit spreads, and the pull-back from central banks makes this all the more difficult to evaluate. However, in the end quality always leads the recovery so when the market decides to turn, investment grade will be the first to rally. Until then, the 4%-plus yields on offer in short dated investment grade look attractive for the carry alone in what remains a highly uncertain market. At this stage in the cycle, opportunities don’t tend to hang around for long and in fixed income, unlike equities, you are paid while you wait for the rally. Considering the protection breakevens offer, the roll-down gains from the steepness of the front end of the curve and the challenge of timing the market perfectly, we think asset allocators should be regarding this as an attractive entry point for investment grade credit.