Equity market volatility has been relatively subdued for most of this year. The CBOE Volatility Index (VIX), commonly referred to as a ‘fear index’ is used to measure US equity market implied volatility and, despite this year being characterised by political uncertainty and rising geopolitical tensions, the VIX index has been hovering near all-time lows – until last week.
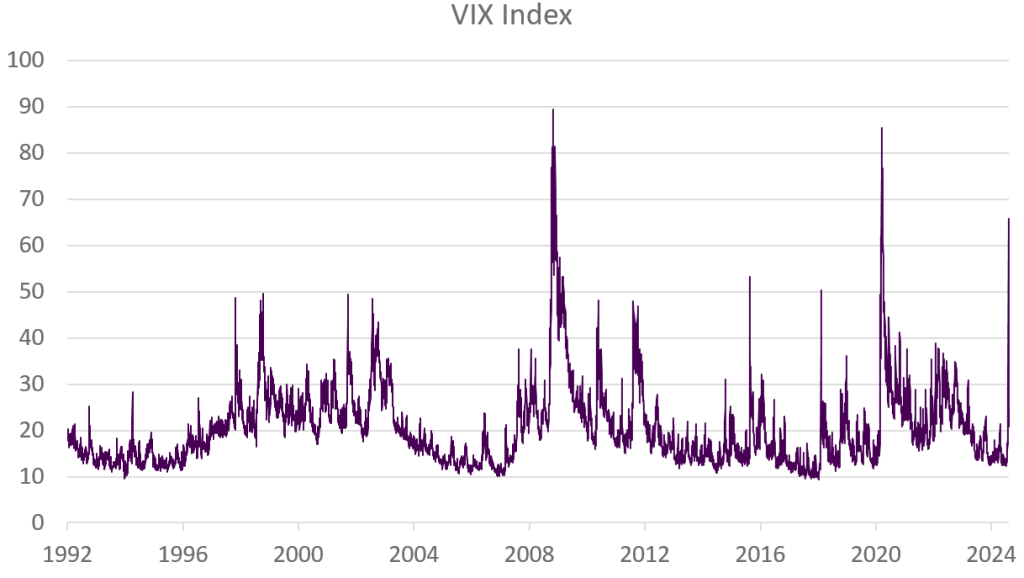
Last week began with Japanese equities suffering their worst ever day of performance, plummeting over -12% on the day. Equity indices in the rest of the world soon followed suit, recording sharp losses in what many compared to Black Monday. Volatility surged, with the VIX index climbing to over 65 on an intraday basis. This marked the largest one-day jump in VIX since March 2020, and the second-highest intraday spike in implied market volatility since the Global Financial Crisis (Chart 1).
At the centre of the panic were concerns over US recession risk and the Bank of Japan’s surprise rate hike marking the beginning of a new tightening cycle. This, in turn, led to a rapid unwinding of carry trades.
However, despite the intense panic on Monday, investors’ fears soon calmed. A series of reassuring data releases and calming comments from central bank officials last week helped alleviate imminent US recession fears, with markets appearing to be normalising as the VIX ended the week just above 20.
Chart 1: Volatility spike: VIX spiked to its second highest intraday level since Global Financial Crisis

Equity markets have somewhat recovered from the steep losses experienced last Monday. However, after four consecutive weeks of declines, equities still ended last week 5% below their recent highs.
We entered this sell-off with a modestly negative view on equities at the cross-asset level. However, with this sharp spike in volatility unsettling investors, our measure of investor sentiment has reached overly pessimistic levels. This typically signals that the sell-off in stock markets may have gone too far. Our view on stocks has now become slightly more positive at these levels, as investor sentiment could continue to recover.
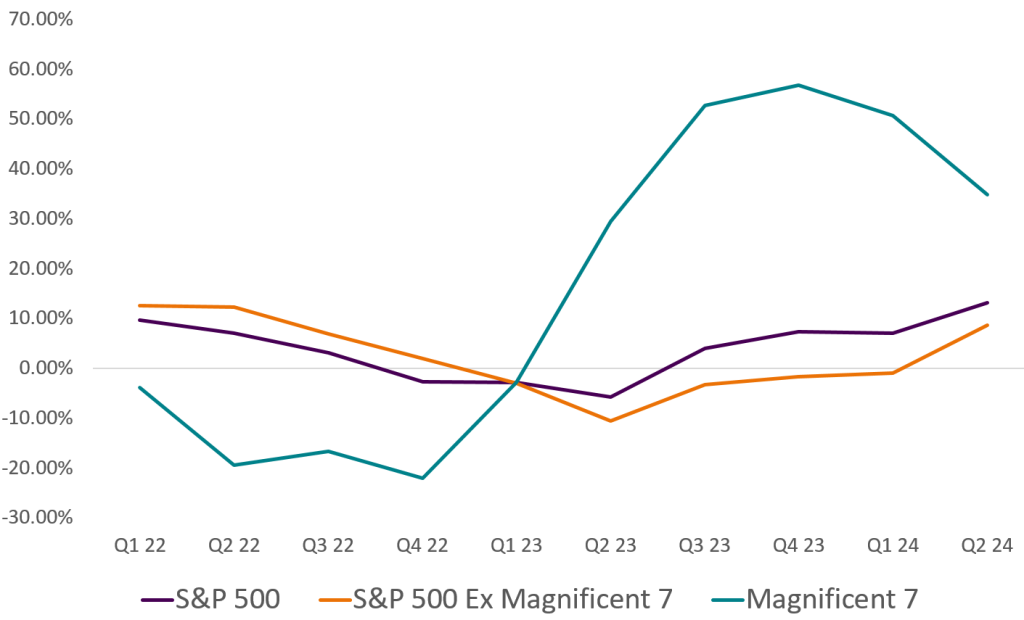
Looking further ahead, with the recent spike in volatility potentially moving behind us, investors may once again shift their focus towards fundamentals and corporate earnings. Whilst profit growth for the mega-caps has stalled recently, signs of strength from the rest of the index could support a broader rally (Chart 2). Volatility spikes are common during the summer, but in our view, corporate earnings will likely set the direction for markets over the remainder of the year.
Chart 2: Gap between profit growth of Magnificent 7 versus the rest of the market is shrinking


