Over the past two years, we have seen the price of gold rise by more than 65% from around $1,600 an ounce to new all-time highs above $2,700 as of 21 October 2024.
This marks a 15% outperformance versus global equities, which themselves have seen very strong gains to new highs over the same period. As gold is traditionally considered a safe haven asset, seeing such strength during a time when risk assets are doing well is particularly interesting.
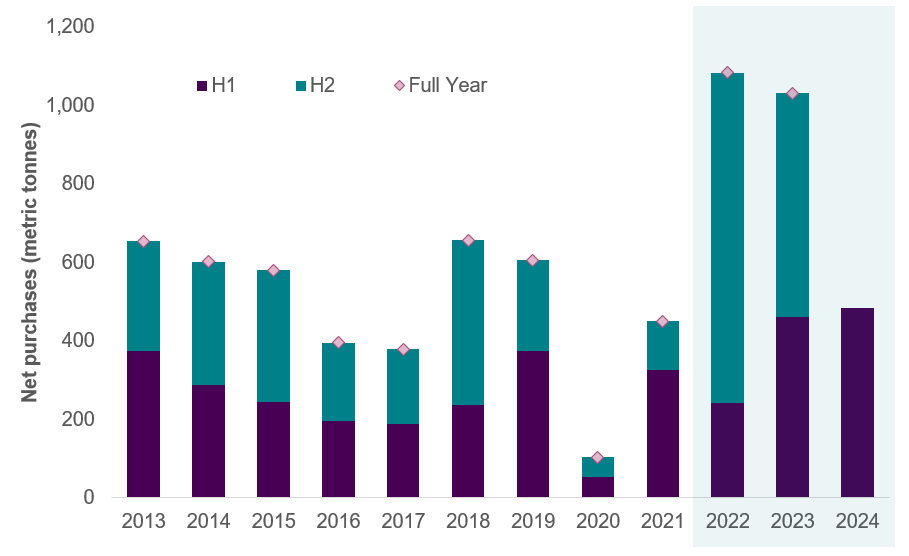
Gold has benefitted from multiple positive drivers over the last couple years. The recent bull run started some months after the Russian invasion of Ukraine at the beginning of 2022. There has been a strong uplift in demand for physical gold. Central banks are one of the main buyers of the yellow metal, particularly those in emerging market countries, that have accumulated their gold reserves in the uncertain geopolitical environment. Net purchases of gold by central banks reached an all-time high in 2022, at more than one thousand metric tons per year (Chart 1), worth more than £60bn at today’s prices. This strong central bank demand has yet to show meaningful signs of stopping, with large purchases continuing this year so far. The motivations behind this move have been widely discussed, with the diversification away from dollar-based assets being cited as one key reason, following the US decision to permanently confiscate Russian US dollar-based foreign exchange reserves.
Chart 1: Global central bank net gold purchases (metric tonnes)

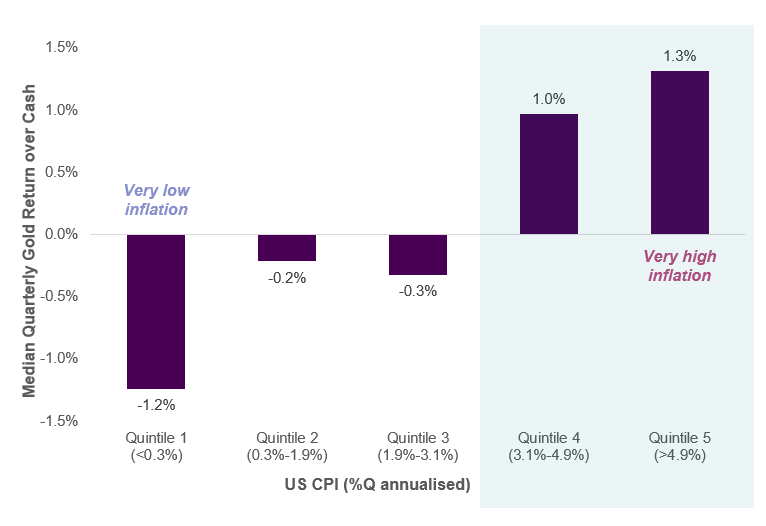
Gold has traditionally shown itself to be a hedge against inflationary pressures, with the price of gold typically rising in an environment of high inflation. We have seen exactly that play out over the last couple years: as inflation surged to the highest level since the 1980s in many countries across the globe, gold made new all-time highs in the aftermath. The historical relationship between inflation and the excess returns of gold over cash can be seen from Chart 2.
Chart 2: Median quarterly return of gold vs cash and US CPI

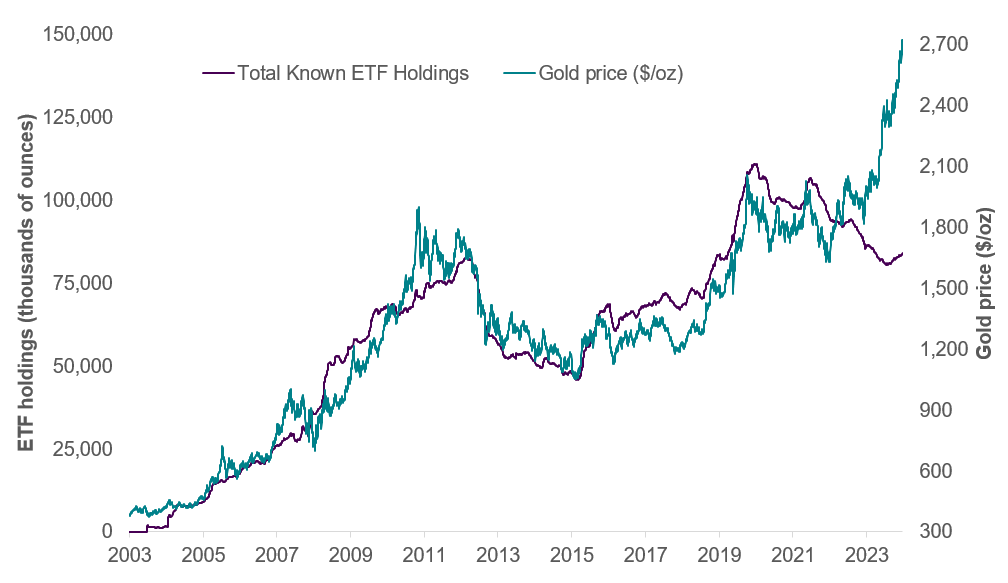
There was a big shift in the investment landscape for gold in 2003, which is when the first gold exchange-traded fund (ETF) was launched, and it can be argued that this wider access led to the massive bull run into the early 2010s. Over the last 20 years, there has been a significant positive relationship between ETF holdings and the price of gold, up until late 2022 when gold powered ahead despite ETF holdings remaining on a downtrend. The hole left by traditional investors was likely filled by central bank demand. The positive historical relationship between the two has come back into life more recently, as ETF holdings have risen for four consecutive months to end of September 2024 (Chart 3).
Chart 3: Gold ETF holdings and gold price

We are firm believers in diversified portfolios that include real assets, such as a diversified exposure to commodities (including gold) and commercial property, as part of a strategic asset allocation. We have also maintained a positive tactical view on gold for the past few months. Geopolitical risk remains elevated, and with the upcoming US Presidential election, we believe this could serve as a hedge against our positive views on equities.
This is a financial promotion and is not investment advice. Past performance is not a guide to future performance. The value of investments and any income from them may go down as well as up and is not guaranteed. Investors may not get back the amount invested. Portfolio characteristics and holdings are subject to change without notice. The views expressed are those of the author at the date of publication unless otherwise indicated, which are subject to change, and is not investment advice.

