
- Broad commodities, led by precious metals, have rebounded strongly since March 2024, fuelled by geopolitical tensions and disruptions in oil supply.
- Precious and industrial metals have shown resilience amidst global economic recovery and manufacturing growth, supported by tight supply chains.
- Launched in 2021, the WisdomTree Broad Commodities UCITS ETF (PCOM) has been designed to give investors smart exposure to commodities by incorporating physical gold and silver.
- Physical precious metals consistently outperformed their synthetic counterpart. As a result, PCOM showed a consistent overperformance against its main competitors, contributing notably to its enhanced returns.
- Related ProductsWisdomTree Broad Commodities UCITS ETF – USD AccFind out more
Broad commodities have had a renaissance moment since the middle of March 2024, wiping out the prior six-months of losses. The rebound has been led by precious metals but has been joined by industrial metals and energy. Elevated geopolitical risks have propelled gold to an all-time high. The escalating war between Israel and Iran threatens to disrupt the flow of oil over and above the disturbances around the Red Sea, which has driven a premium in oil prices. While the geopolitical tensions have hurt other cyclical assets, like equities, commodity prices have proven to be resilient given that the tensions threaten their supply.
Silver has followed on gold’s coattails higher. A resilient global economy where manufacturing appears to be making a rebound has certainly helped silver, as well as industrial metals. Industrial metal producers have reacted to prior weak prices by decelerating capital expenditure and, in some cases, closing production. Several nickel producers in Australia, for example, have shut down operations. Copper smelters in China have coordinated to reduce production amid a lack of ore availability. The visible signs of tightness are helping metal prices form a base and rise from it. The contango in gold and silver remains stable, despite the signs of metal tightness. That is partly because the above-ground stock (including investment in bullion) is large.
A smart exposure to precious metals
In 2021 WisdomTree launched a product with the aim of offering an enhanced way to get exposure to commodities: the WisdomTree Broad Commodities UCITS ETF (PCOM). Offering an innovative solution, this ETF is designed for investors seeking to improve their commodities performance while minimising tracking errors against the Bloomberg Commodity Total Return Index (BCOMTR Index). PCOM’s proposition is simple. It replaces the synthetic gold and silver exposure of the Bloomberg Commodity Index (BCOM) with a physical one. Operationally, the fund combines a synthetic exposure to the ex-precious metals’ component of the Bloomberg Commodity Index and a physical exposure to gold and silver through investments in physically backed ETPs. Find out more about the structure of the product in our blog.
Figure 1: The physical premium
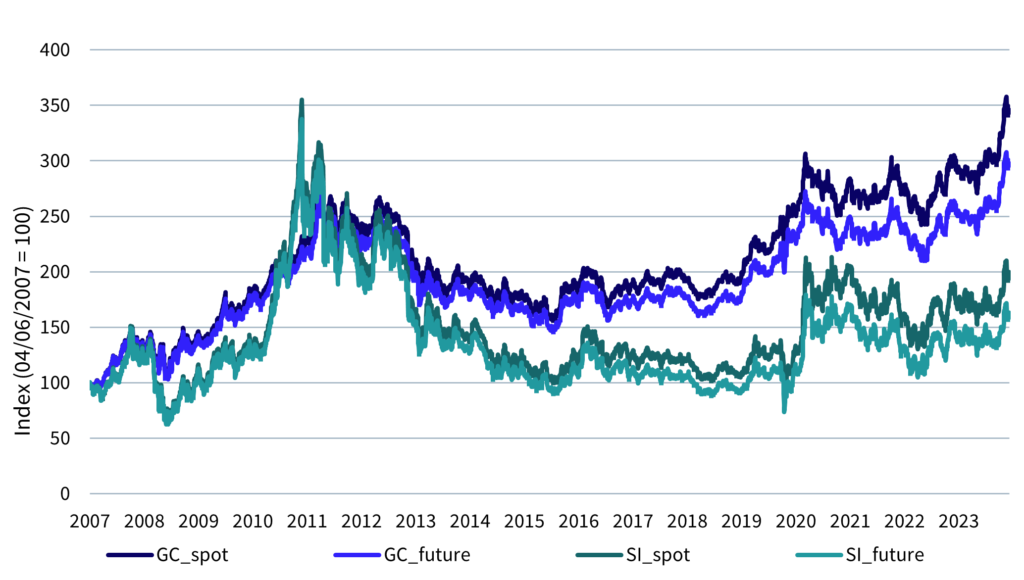
In our previous analysis, we showed how, over the past 15 years, a gold and silver physical investment would have outperformed its synthetic counterpart and did so consistently. Figure 1 shows the historical outperformance of the spot price of gold and silver compared to a fully-funded synthetic exposure for investment. Since 2007, physical gold and silver consistently outperformed synthetic gold and silver, and they did so across very different market regimes. The historical physical overperformance has been, on average, +0.96% for gold and +1.28% for silver, which maps to an additional performance for PCOM of roughly 17 bps per year1.
But what about the performance since the launch of the ETF? As shown in Figure 2, the enhancement added 52 bps to the product performance, which is in line (and even slightly better) with what our previous analysis suggested. That seldom happens in the investment world, where investment strategies often ‘fail to replicate’ out of sample.
Figure 2: The physical enhancement
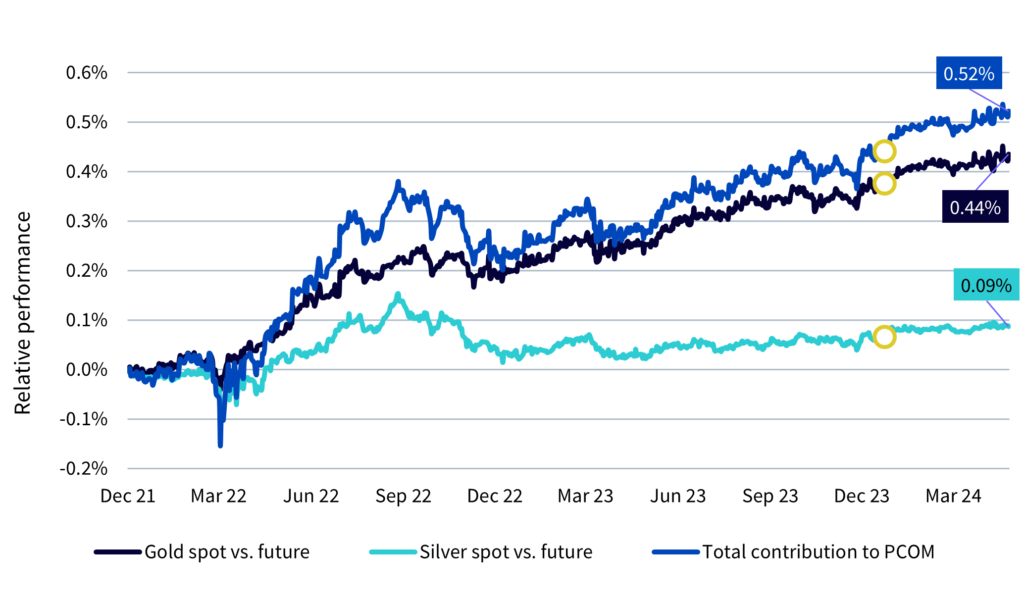
Source: Bloomberg, WisdomTree. Start date: 03/12/2021; end date: 30/04/2024. The yellow dot represents the beginning of 2024. Historical performance is not an indication of future results and any investments may go down in value.
PCOM vs. competitors
This translated into an overperformance of PCOM vs its two main competitors by assets under management (AUM), namely:
- The iShares Diversified Commodity Swap UCITS ETF (ICOM)
- The Invesco Bloomberg Commodity UCITS ETF (CMOD)
Unlike PCOM, these two “traditional” products invest in a fully futures-based basket of commodities tracking the Bloomberg Commodity Index. Figure 3 shows the relative performance of PCOM vs ICOM and CMOD.
Figure 3: PCOM vs competitors
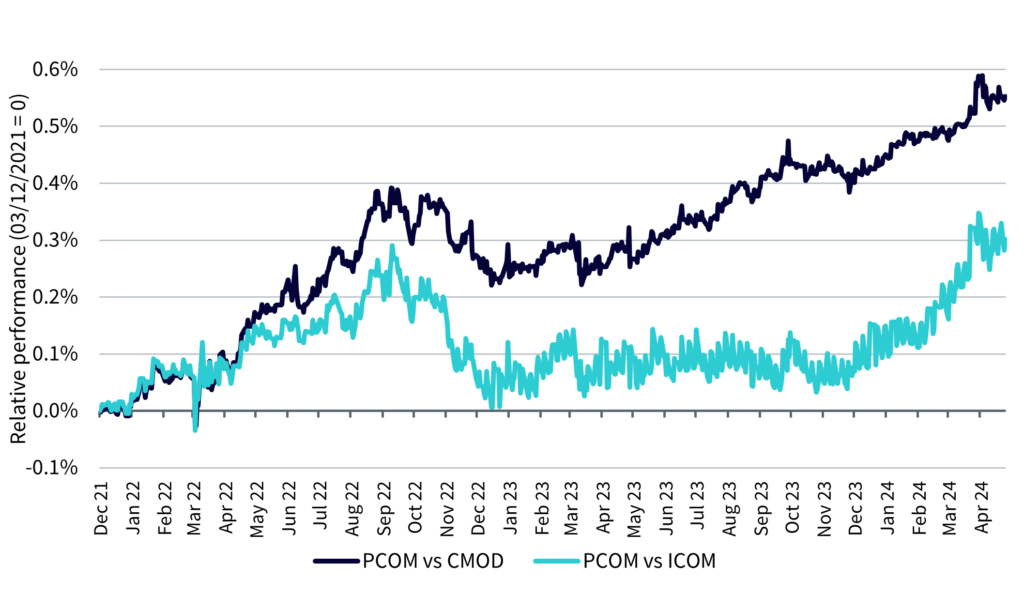
Source: Bloomberg, WisdomTree. Start date: 03/12/2021; end date: 30/04/2024. Historical performance is not an indication of future results and any investments may go down in value.
With the exception of the last quarter of 2022, PCOM’s overperformance compared to its two main competitors has been fairly steady, particularly with respect to CMOD. Specifically, the relative performance vs. CMOD mirrors the total cumulative enhancement that substituting synthetic precious metals with physical ones was supposed to bring. This suggests that the investment insight brought forward in the previous paragraph is actually well implemented in PCOM. To see further how, let’s take a look at the split of this relative performance.
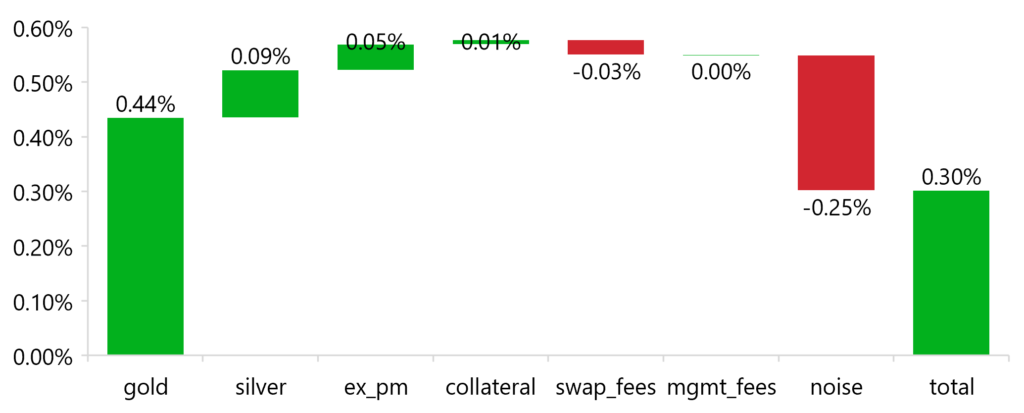
Figures 4 and 5 show, to the best of our knowledge, the (dollar) performance attribution of PCOM’s performance vs. CMOD and ICOM, respectively. The comparison assumes that the collateral of the three ETFs is the same. It starts at PCOM’s inception (03/12/2022) and ends at 30/04/2024.
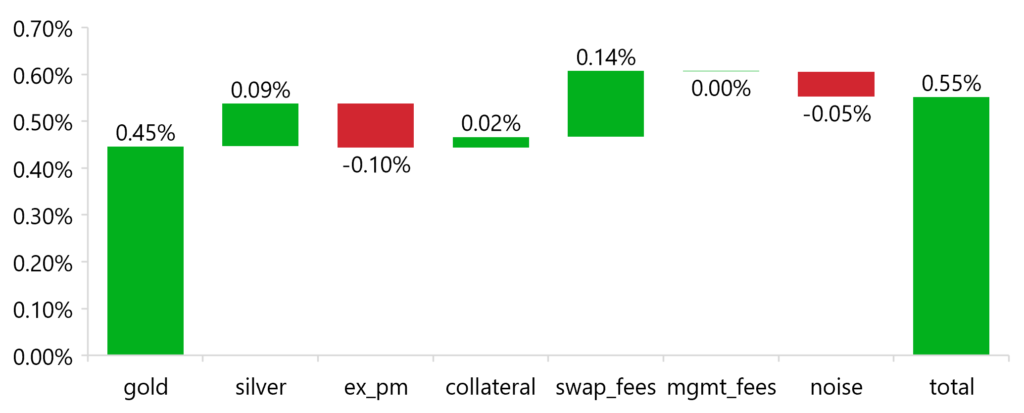
The biggest source of performance is spot gold, which added roughly 45 basis points (bps) to the relative performance. Then silver, +9 bps. The swap fees differential added 14 bps for CMOD and detracted 3 bps for ICOM2. To conclude, the ex-precious metals component detracted 10 bps.
So, we would expect roughly 60 bps of outperformance for CMOD and 55 bps for ICOM. The actual number though, stands at a slightly lower mark, how it is represented by the last “noise” bar. The overperformance is still very strong: 55 bps overperformance vs CMOD and 30 bps overperformance vs ICOM.
Figure 4: PCOM vs ICOM
Source: Bloomberg, WisdomTree. Start date: 03/12/2021; end date: 30/04/2024. Historical performance is not an indication of future results and any investments may go down in value.
Figure 5: PCOM vs CMOD
Source: Bloomberg, WisdomTree. Start date: 03/12/2021; end date: 30/04/2024. Historical performance is not an indication of future results and any investments may go down in value.
In the analysis above we assumed that PCOM and its competitors share the same collateral3, so we can guess that some, if not most, of the unexplained performance of this “noise” component comes from a different collateral performance. Two of the reasons for different collateral performances are:
1. Securities lending4: Where collateral securities are lent out in exchange for a fee.
2. Collateral composition, and, in particular, duration: Over the last two years, the shorter the duration of the collateral, the better the collateral would have performed.
In general, we think it prudent not to engage in securities lending to avoid unnecessary counterparty risk, and we try to keep the collateral of the products as plain as possible. The conclusion is clear: replacing futures-based silver and gold with physical precious metals enhances performance.
Conclusion
Despite geopolitical tensions, broad commodities have rebounded since March 2024, driven by precious metals, industrial metals, and energy. The primary objective of PCOM is to outperform BCOM and BCOM’s trackers over the long term by enhancing performance using physical precious metals instead of getting synthetic exposure. Consistently with our historical analysis, the ETF is hitting its target: physical gold and silver outperform their synthetic counterparts, and PCOM has consistently beat BCOM’s tracker since its launch.
1 This number takes into account the weight of Gold and Silver within the BCOM index
2 PCOM pays 12 bps swap fee only on the ex-precious metals portion of the portfolio. For ICOM, the weighted average swap fee is reported to be 8.77 bps.
3 The “dollar attribution” methodology can give rise to a non-zero contribution even if the underlying performance is the same. That’s why, even if we assumed the same performance for the collateral, the contribution is slightly positive. The same applies for the ex-precious metals component.
4 As reported on iShares website, ICOM engages in securities lending on their collateral.