
Commodities were doing well — beating bonds and real estate and keeping up with global equities —until June 2024 (Figure 1). July was a bad month for the asset class and the cross-market volatility in August reset the gameboard. August was an especially unusual month, initially wreaking havoc across many assets, but ultimately most assets settled the month higher. We have described the events of August as a storm in a teacup. Weak US labour market data released on 2 August triggered a sell-off in risk assets as markets feared that the U.S. Federal Reserve had let policy remain too tight for too long. On 5 August 2024, Japanese stocks had their worst trading session since 1987 as the Japanese Yen appreciated against the US Dollar and triggered an unwind of carry trades. That compounded the global sell-off, driving the VIX (S&P 500 volatility index) to an intraday high of over 60 on 5 August — a level we last saw during the COVID pandemic (and the sovereign crisis of 2011 and Global Financial Crisis of 2008 before that). OVX (oil price volatility) and MOVE (bond market volatility) also spiked, marking multi-month highs, but this was not as sharp an increase as we saw in the equity market.
Key Takeaways
- Commodities were doing well until June 2024. Market volatility in August has pushed the relative ranking of the asset class back further. Commodities thus have more catching up to do.
- The chances of a catch-up are boosted by rate cuts but are hampered by worries of adverse trade policies.
- Commodity market bearishness is likely overdone, and some commodities are ripe for a short-covering rally.
- China’s economic stagnation could be assuaged by rate cuts and the country’s policy shift in favour of green technology could be a structural boost for commodity demand.
Commodities were doing well — beating bonds and real estate and keeping up with global equities —until June 2024 (Figure 1). July was a bad month for the asset class and the cross-market volatility in August reset the gameboard. August was an especially unusual month, initially wreaking havoc across many assets, but ultimately most assets settled the month higher. We have described the events of August as a storm in a teacup. Weak US labour market data released on 2 August triggered a sell-off in risk assets as markets feared that the U.S. Federal Reserve had let policy remain too tight for too long. On 5 August 2024, Japanese stocks had their worst trading session since 1987 as the Japanese Yen appreciated against the US Dollar and triggered an unwind of carry trades. That compounded the global sell-off, driving the VIX (S&P 500 volatility index) to an intraday high of over 60 on 5 August — a level we last saw during the COVID pandemic (and the sovereign crisis of 2011 and Global Financial Crisis of 2008 before that). OVX (oil price volatility) and MOVE (bond market volatility) also spiked, marking multi-month highs, but this was not as sharp an increase as we saw in the equity market.
However, markets calmed relatively quickly. The S&P 500, MSCI World, Bloomberg Commodity Index are all back to or above the levels we had at the beginning of August before the accelerated sell-off, but July had already been a negative month for commodities. Real estate and sovereign bonds have gathered speed in August, after looking like laggards until mid-July. That means that commodities are now ranking the lowest in the group and not even beating cash.
Figure 1: Asset price performance compared
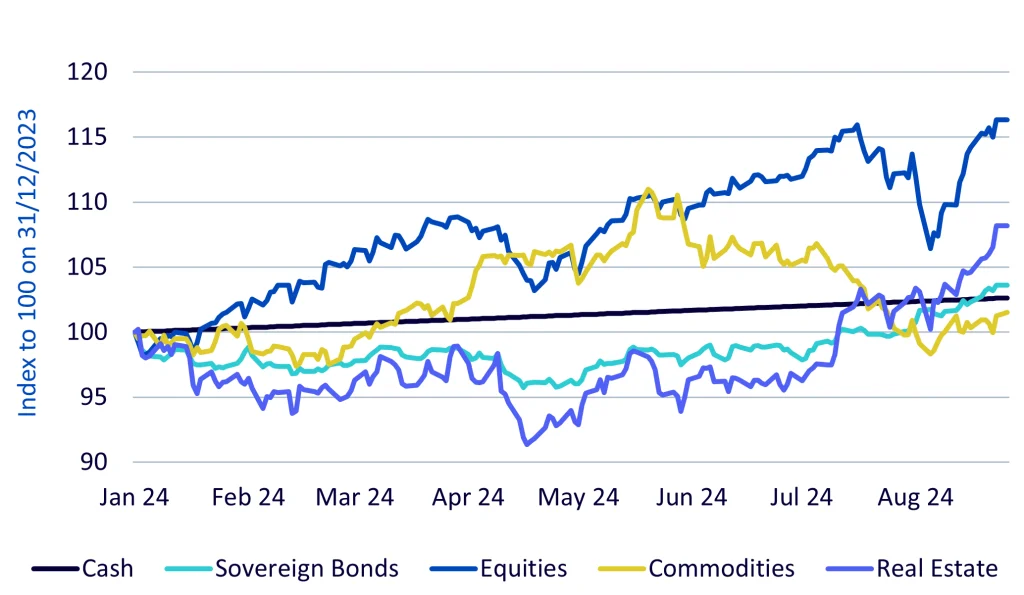
Source: WisdomTree, Bloomberg. 31 December 2023 to 26 August 2024. All returns are in USD. Data: Data: Equity – MSCI World, Bond – Bloomberg Barclays Agg Sovereign TR Unhedged, Real Estate – EPRA/NAREIT Global, Bloomberg Commodity Total Return Index, Cash – US T-Bill 3 month. Historical performance is not an indication of future performance, and any investments may go down in value.
So, what are the prospects for a catch-up? On the plus side, we have rate cuts on the horizon. On the negative side, we still have the U.S. presidential election in which global trade policy could become the pollical football.
Interest rate cut cycle begins
With the U.S. widely expected to join Canada and many parts of Europe in cutting interest rates on 18 September, we believe the world economy could see some additional policy support. China has been waiting for others to loosen monetary conditions before it begins in earnest. More policy support from the world’s largest commodity consumer should be a boon for commodities.
Lower U.S. interest rates have historically been a positive driver for real commodity prices (Figure 2). We note that the relationship inverted during the oil price crash in 1980s. During the COVID crisis, while lower rates were better for commodities (with a beta like other periods), the impact of the shock sent prices generally lower (lower alpha).
Figure 2: Real commodity prices and interest real rates
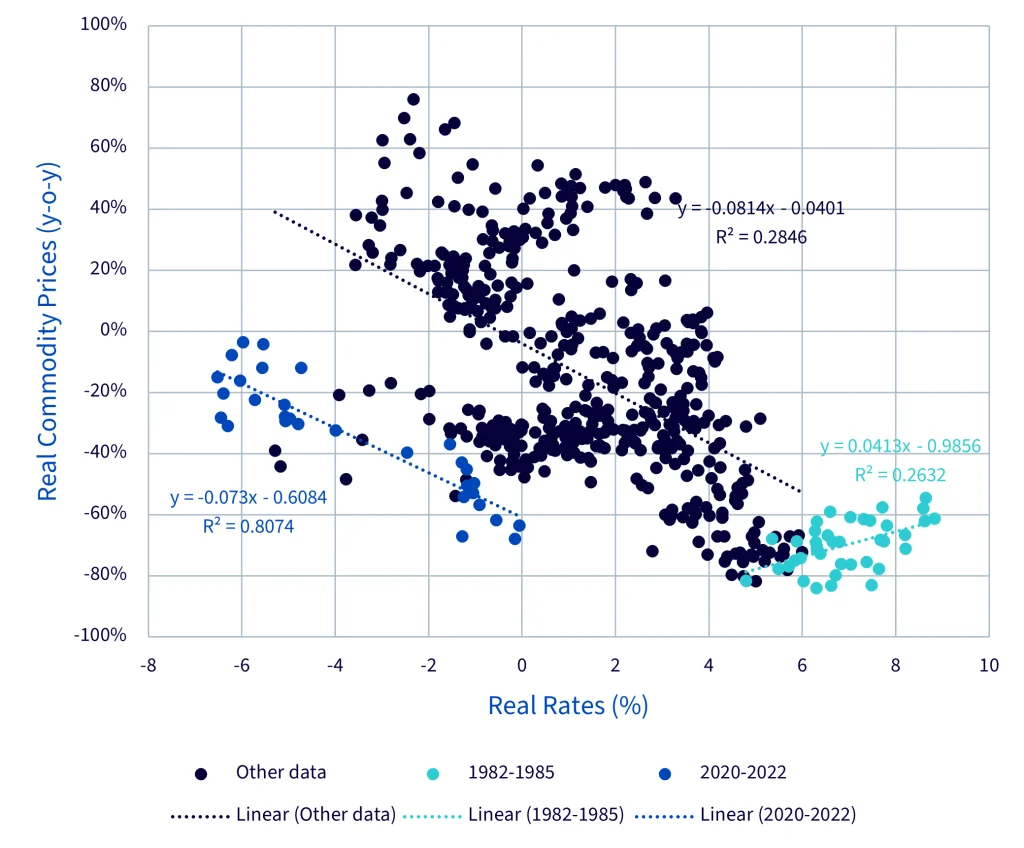
Source: WisdomTree, Bloomberg, data from June 1976 to June 2024. Real commodity prices calculated using Bloomberg Commodity Price index and US Consumer Price Index. Real rates calculated using nominal 2-year US Treasuries and US Consumer Price Index. 1982-1985 period represents a negative oil price shock. 2020-2022 represents the COVID shock. “Linear” is the regression line for the relevant data set. Regression equations annotated on chart, where y is the real commodity price (dependent variable), and x is the real rate (independent variable). R2 tells us how much of the variation of the dependent variable is explained by the independent variable (scale of 0 to 1). Historical performance is not an indication of future performance, and any investments may go down in value.
Global trade
2024 has been and will continue to be a busy election year. The U.S. presidential election is clearly one of the major events in this calendar year. Trump and his running mate Vance have campaigned on a platform of being trade hawks. If they are successful in winning the White House and follow through with their campaign policies, we could see a negative trade shock, and that could eventually be bad for commodity prices. Figure 3 shows historically lower export volumes have been associated with lower commodity prices. At the time of writing, the polls indicate a tied race between Trump and Harris and experience from elections elsewhere — France, UK, India — has highlighted that outcomes are not easily predictable and almost anything can happen.
Figure 3: Export volume and commodity price performance
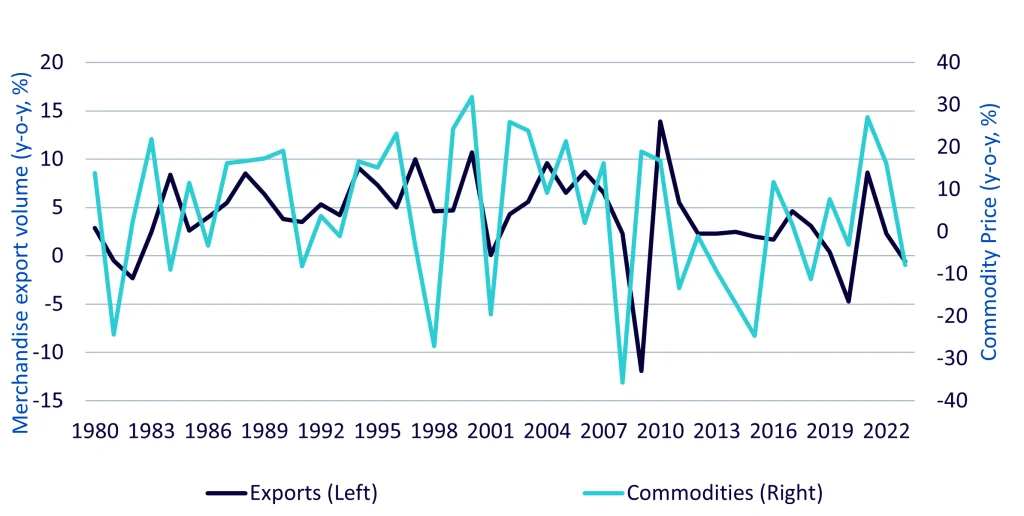
Source: WisdomTree, Bloomberg, World Trade Organisation. 1979-2023. Commodities represented by Bloomberg Commodity Price index. Historical performance is not an indication of future performance, and any investments may go down in value.
Trump’s proposed plans for major tariffs on U.S. imports may take many months before implementation. Bearing in mind inauguration would be 20 January 2025, if we assume an expedited three to four months for a U.S. Trade Representative Section 301 process1 and then another month for sign off, we will be in the middle of 2025. In that time, central banks around the world will have delivered several interest rate cuts, stimulating the global economy. As we discussed earlier, gold will benefit from the monetary stimulus, but fears around a potential trade war could drive the metal up even further. Gold is often seen as a hedge against geopolitical and economic turbulence.
We stress at the time of drafting we don’t know who the next president will be. Even if Harris is successful, the chances are that the U.S. will tighten trade (but maybe not a central part of the campaign platform). In May 2024, President Biden announced a widening of Section 301 tariffs on a number of Chinese imports to include solar panels, electric vehicles, batteries, green energy supply chain inputs, ship-to-shore port cranes, steel products, aluminium products, medical syringes, and personal protective equipment (PPE). If adopted, some of the new tariffs would enter effect this year, while others would phase in gradually in 2025 and 2026. There are notable carve-outs. For example, the increase in battery tariffs exclude lithium-ion batteries for electric vehicles.
Last year the European Union introduced the Foreign Subsidies Regulation (FSR). These new rules enable the European Commission to address distortions caused by foreign subsidies. The rules limit investments when non-EU firms are found to unduly benefit from subsidies provided by their own governments. Such probes are now targeting Chinese cleantech manufacturers. Utilisation of these new rules could present a decline in trade from the EU as well.
Other major commodity catalysts
We have recently commented on China’s relative economic disappointment, but there are reasons for optimism in the commodities markets as the country shifts its economic model: China’s big move in the energy transition and what it means for commodities
We have also discussed why bearishness in commodities looks overdone and the potential for short-covering rallies: What’s Hot: Have commodities hit peak bearishness? What happens next?
In all the market volatility over the past month and political uncertainty ahead of us, gold has clearly been a winner. We expect it to continue to be a leading commodity and comment on its prowess in time of financial stress in: Gold usually dips before making substantial gains in financial crises. Following closely on gold’s coattails is silver: What’s Hot: Can silver win the gold medal?
The full outlook can be viewed here.
1 Section 301 of the Trade Act of 1974 grants the Office of the United States Trade Representative (USTR) a range of responsibilities and authorities to investigate and take action to enforce U.S. rights under trade agreements and respond to certain foreign trade practices. Prior to the Trump Administration and since the establishment of the World Trade Organization (WTO) in 1995, the United States used Section 301 authorities primarily to build cases and pursue dispute settlement at the WTO. Former President Trump was more willing than previous officials to act unilaterally under these authorities.