
As one of the world’s largest economies the US is a key focus for investors. With every country attempting to return to normality following the coronavirus pandemic, we are monitoring when US economic activity might get back on track, as well as other measures of “normality” such as entertainment and leisure, high street shopping, and schools reopening. The result is an index that measures progress toward a post-pandemic world
Our Return to Normal Index
As the US continues its Covid-19 vaccination program, the Return to Normal Index measures human activity data relative to pre-pandemic levels. The index is constructed by our data scientists and fundamental analysts and tracks activities in the US, including travel, returning to work and school, brick-and-mortar shopping and eating out. By design, the index is focused on measuring components of daily life rather than economic indicators such as GDP growth. The percentage level will move closer to 100 as daily life normalises, and our analysts will update it on a regular basis.
What has changed?
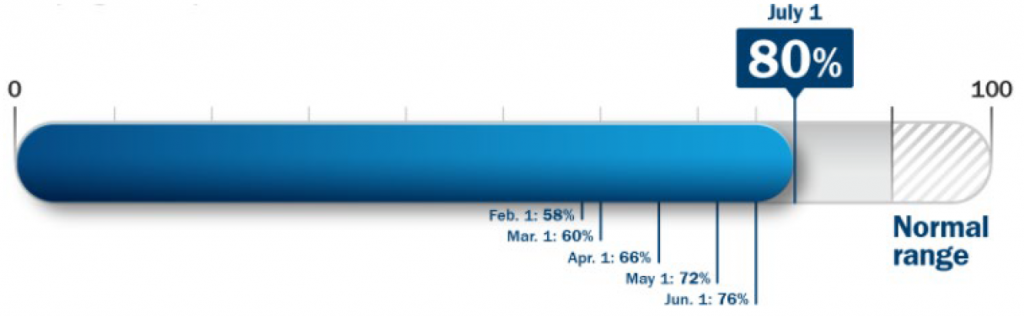
Source: Columbia Threadneedle Investments, 1 July 2021
What are we Monitoring, and where is it at?
As the US continues its Covid-19 vaccination program, the Return to Normal Index measures human activity data relative to pre-pandemic levels. The index is constructed by our data scientists and fundamental analysts and tracks activities in the US, including travel, returning to work and school, brick-and-mortar shopping and eating out. By design, the index is focused on measuring components of daily life rather than economic indicators such as GDP growth. The percentage level will move closer to 100 as daily life normalises, and our analysts will update it on a regular basis.
Figure 2: Tracking inputs
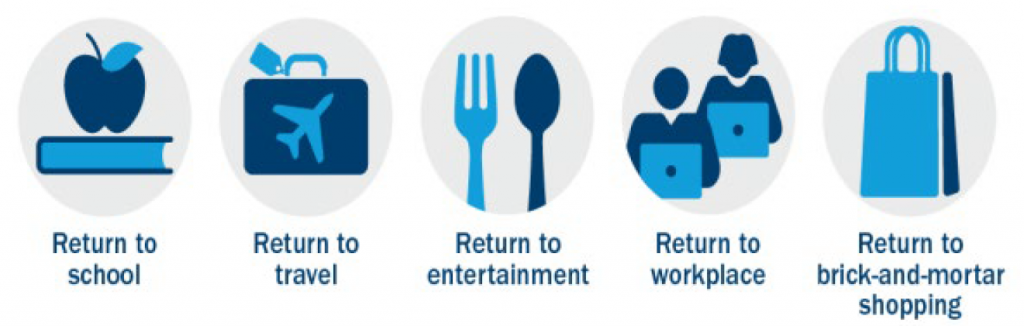
Our index suggests we’re still 20% below pre-Covid activity levels. The levels of component activity vary: the return to brick-and-mortar stores is 13% below its pre-Covid levels and a normal work routine is 19% below pre-Covid. Travel and entertainment activity has recently had a stronger recovery, but it continues to lag other categories at 23% below pre-Covid levels. The return to school data may not see a meaningful gain until the fall – as long as a return to in-person schooling is more widely implemented
What Could Drive Change?
Faster vaccine distribution and uptake could accelerate the path to normal (ie, the upside case). Developments that could impede a return to normal (ie, the downside case) include the emergence of variants that are resistant to current vaccines or slower uptake of the vaccine in certain places (because of people’s unwillingness to get vaccinated or shortfalls in supply).
Figure 3: The Return to Normal Index over time – level as of 1 July 2021: 80%
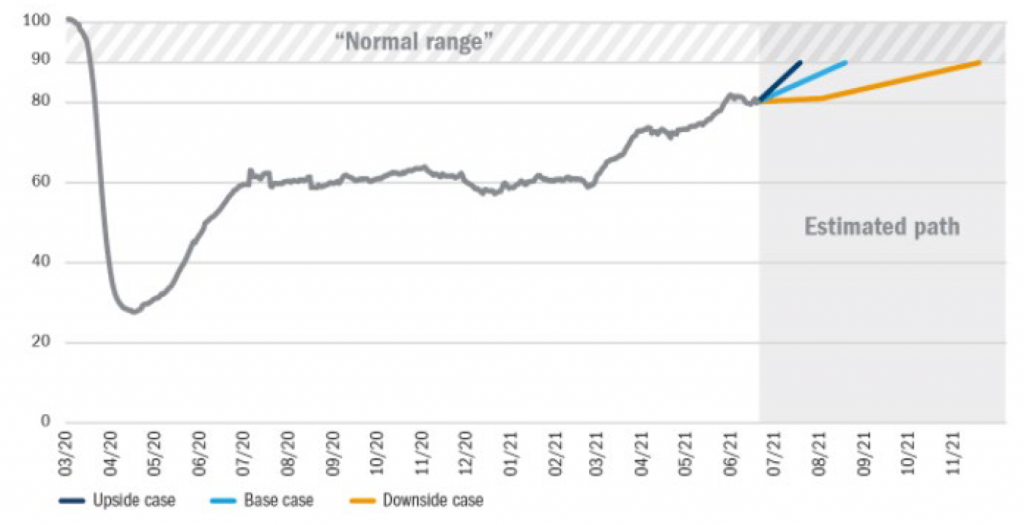
Source: Columbia Threadneedle Investments, 1 July 2021