

Liquidity in fixed income markets has become more challenged given the fall-out from liability-driven investment (LDI) selling. With recession and energy crisis worries, Head of Loans David Milward discusses whether loans can continue to show resilience through the market volatility.
As we approach the close of 2022, it has no doubt been a volatile year for risk assets, with investors struggling for places to hide from the market mayhem. While loans have not escaped the synchronised sell-off, total and excess returns suffered the least along with asset backed-securities (ABS) over the year to date (Figure 1). High yield (HY), for example, endured double-digit losses. This is partly attributable to the sharp repricing in short-term interest rates, which is generally beneficial for floating rate assets such as loans, as it will drive overall returns higher. As retail investors are significant participants in credit markets, this leaves them arguably more susceptible to selling pressure compared to the ‘stickier’ capital provided by collateralised loan obligations (CLOs) investors, who constitute more than 50% of the loan market in Europe.
Figure 1: European loans resilient in 2022
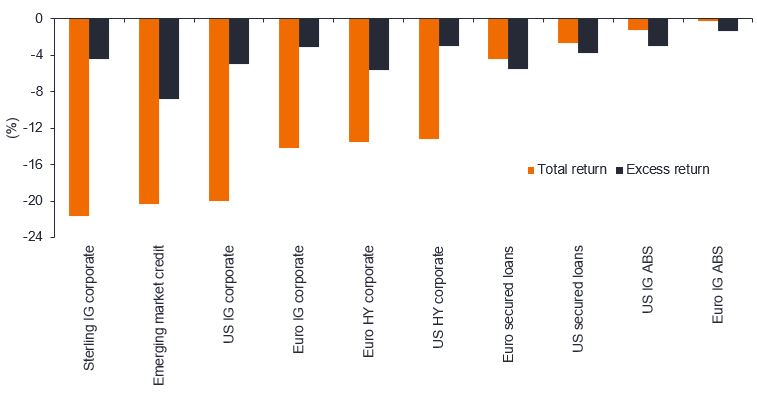
Source: Janus Henderson Investors, ICE BofA, Credit Suisse, Barclays, 1 January to 31 October 2022.
Note: Excess return: fixed rates vs swaps, floating rate less Libor. HY = high yield. IG = investment grade. ABS = asset-backed securities.
Any differences among portfolio securities currencies, share class currencies, and your home currency will expose you to currency risk.
Past performance does not predict future returns.
With global recession concerns brewing, will the loan market continue to ride the market volatility? Here we consider this by unpicking some of the myths around loans.
Myth: CLOs will be significant forced sellers of loans
The CLO market is a key driver of European loan market liquidity. Despite material spread widening over the past few months (partly due to the liability-driven investment or LDI crisis, which has forced pension schemes to liquidate assets to raise additional collateral), CLO deals are still being printed. So far this year, there has been EUR€21.4 billion of new issues from 54 deals1. The latest issuance forecasts for 2023 are wide ranging (EUR€23-38 billion2), but encouragingly this market remains open and at healthy levels of expected issuance.
As credit quality inevitably deteriorates amid the economic downturn, a key risk facing CLOs – and therefore loans – is a rise in CCC ratings that might impact CCC buckets and thus over-collateralisation3 (OC) tests. As such, investors are increasingly nervous about holding low B-rated names, particularly in more cyclical sectors, which has exacerbated some of the sharp price moves. That being said, CLO managers are not automatic forced sellers of CCC or low-priced assets. The structures typically allow a portfolio to hold up to 7.5% CCC-rated assets with no consequence (ie. the loans continue to be valued at par for OC purposes). If this limit is breached then the excess must be priced at market value for the OC tests. But even then, the CLO is not a forced seller of these assets.
Myth: Rising interest rates to significantly harm interest cover and refinancing
Borrowers with floating rate debt experience higher interest costs as short-term rates rise, raising concerns about an erosion of interest cover. Considering research from UBS, European loan interest cover could deteriorate to 2.65x amid rising rates, but this level does not imply material stress. This analysis also assumes that borrowers have not hedged any of their floating rate risk, but as many apply some form of hedging, they are partly insulated from rising short-term rates. While we are closely monitoring borrowers, the rising interest burden seems manageable in the near term and growing interest income from higher coupons is set to continue to benefit investors and insulate against price volatility.
Figure 2: Assessing insulation from rising rates
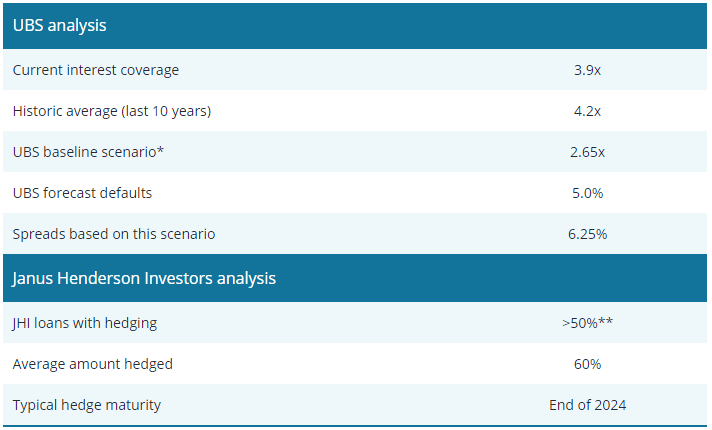
Source: Janus Henderson Investors Analysis, UBS, as at 30 September 2022.
Notes: Interest coverage based on UBS data. Defined as EBITDA/interest expense.
*Assumes earnings growth at +3% for 2023 and the ECB to hike interest rates to 2.25%; Baseline forecast for following year.
**This is a live research topic and is based on 35 issuers we have already received feedback from.
In an era of higher rates, investors are also considering the maturity wall to assess refinancing risk. In the run up to 2024, nearly EUR€8.5 billion of leveraged loans financed by European CLOs – representing 7.8% of the total par amount – are scheduled to mature, with the bulk of maturities occurring in the second half of 20244. However, we would argue that these shorter-dated loans are potentially more attractive given it is likely we will see some form of refinancing during 2023, with many issuers already looking to address maturity issues. This should generate a pull to par on existing issues, many of which are trading below par today.
Myth: High default risk looms while cyclical tilt makes loans relatively more vulnerable
Rising funding costs are of particular concern for sub investment grade (IG) markets given the expected global recession, igniting fears around rising default rates. European loans will not be immune to a rising default trend, but in our view quite a significant amount of downside is already priced in, given recent spread widening.
Figure 3: US expected to record higher defaults than Europe
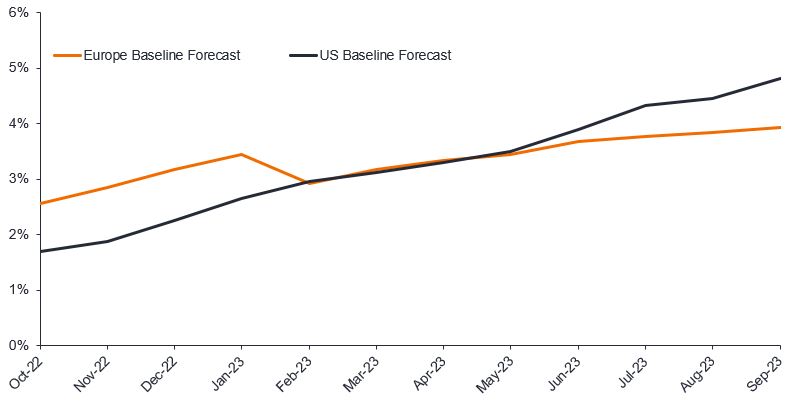
Source: Moody’s, Janus Henderson Investors Analysis, as at 30 September 2022.
Note: Issuer weighted annual default rates. Baseline default rate for speculative grade. There is no guarantee that past trends will continue, or forecasts will be realised.
Even with the expectation that economic growth in Europe is likely to be more challenging, default expectations in sub-IG credit indicate higher potential defaults in the US over Europe (Figure 3). This outcome – while perhaps unexpected – is not uncommon to previous slowdowns and partly reflects the difference in bankruptcy processes across the two regions. We expect European loan default rates to rise, but more gradually than the US. This reflects the absence of covenant triggers, loose documentation (allowing the raising of additional debt to support liquidity as during the pandemic) and significant ownership by private equity houses, which are likely to support businesses through short-term softer trading.
Higher discount margins6(DM) can be beneficial to mitigate default risk. For example, the 3-year DM of 7.3%6 for European loans offers a significant cushion against rising defaults. According to our analysis, a 5% default rate (assuming a 50% recovery) would deliver a loss-adjusted spread return of 4.5%. The 5% default rate is higher than the baseline default forecast for Moody’s and the recovery rate is meaningfully lower than seen in previous downturns, reflecting weaker investor protections in today’s loan market.
Another cause for concern is that in any economic downturn, cyclical sectors and lower-rated businesses are more vulnerable. Reassuringly, the European loan market has lower exposure to more cyclical sectors and less CCC risk than HY or US loans, as evidenced in Figure 4.
Figure 4: Lowest cyclical exposure in European loans
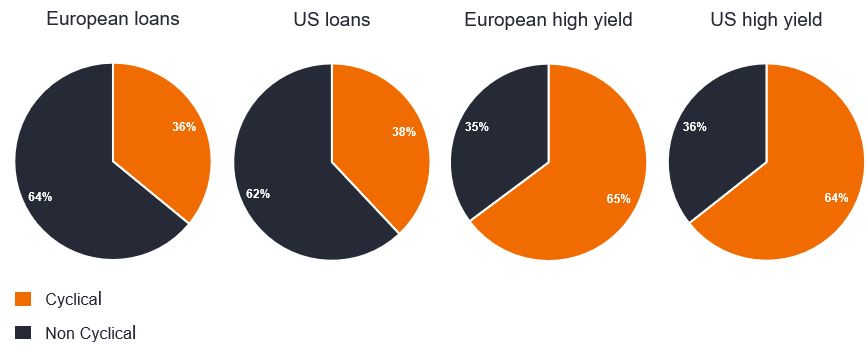
Source: Janus Henderson Investors Analysis, as at 31 October 2022.
Notes: European HY = ICE BofA Euro High Yield EU members & Western Europe Issuers Index; US HY = ICE BofA US High Yield Index; European Loans = CS WELLI; US Loans = CS LLI. Classifications: Cyclical = Aerospace, Automotive, Banking, Basic Industry, Capital Goods, Chemicals, Consumer Durables, Consumer Goods, Energy, Financial, Financial Services, Gaming/Leisure, Housing, Leisure, Manufacturing, Metals/Minerals, Real Estate, Retail, Transportation, Technology & Electronics.
Non-Cyclical = Consumer Non-Durables, Food And Drug, Food/Tobacco, Forest Prod/Containers, Healthcare, Information Technology, Insurance, Media, Media/Telecom, Service, Services, Telecommunications, Utility.
A bounce-back on the horizon?
Liquidity in the European loan market – as in all fixed income markets – has become more challenged given the fall-out from LDI selling pressure. Factoring in recession and energy worries for Europe as well, European loans have underperformed the US over the year to date, delivering -6.7% versus -4.1% in the US6. Compared to HY, European loan spreads are wider across ratings bands – specifically B- and BB-rated – and given the spread widening seen this year, the European loan market is trading wider than many fixed income markets compared to history. Only 17% of the time have spreads been wider over the last 20 years (Figure 5). This signals that European loans may offer compelling relative value and a potential avenue to help stay afloat amid the market volatility.
Figure 5: Spread ranges – percentile rank (time at tighter or wider spreads than current levels)
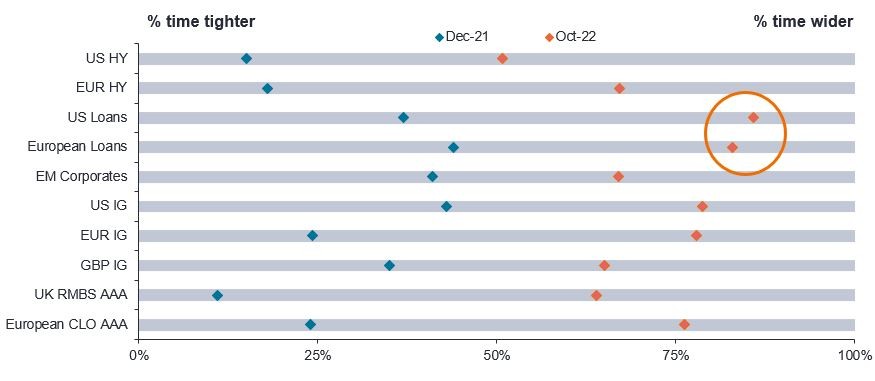
Source: Bloomberg, Credit Suisse, JP Morgan, Janus Henderson Investors Analysis, as at 31 October 2022. HY = loans. IG = investment grade. RMBS = residential mortgage-backed securities.
Note: Data range is 20 years; using 4-year DM for loans. 100% = wider; 0% = tighter.
Index data is for illustrative purposes only and not indicative of any actual investment.
Footnotes:
1 Source: LCD, JP Morgan, Janus Henderson Investors Analysis, as at 31 October 2022.
2 Source: Morgan Stanley, Bank of America, Deutsche Bank, JP Morgan, BNP Paribas and Barclays, as at 1 November 2022.
3 A measure of the cushion available to absorb any defaults within the portfolio of loans for each tranche of CLO debt.
4 Source: S&P Global Ratings, as at 16 August 2022.
5 A discount margin (DM) is the average expected return of a floating-rate security (typically a bond) that’s earned in addition to the index underlying, or reference rate of, the security.
6 Source: Credit Suisse Western European Leveraged Loan Index, 30 September 2022.
7 Source: Credit Suisse, CS Leveraged Loan Index = US. CS Western European Leveraged Loan Index = Europe. Note: Returns hedged to euros as at 26 October 2022. Past performance does not predict future returns.