Equity markets do not appear to be reflecting fair value due to top-down factors. See our five charts on the key trends driving equity markets right now.
Difficult times for stock pickers, better times ahead
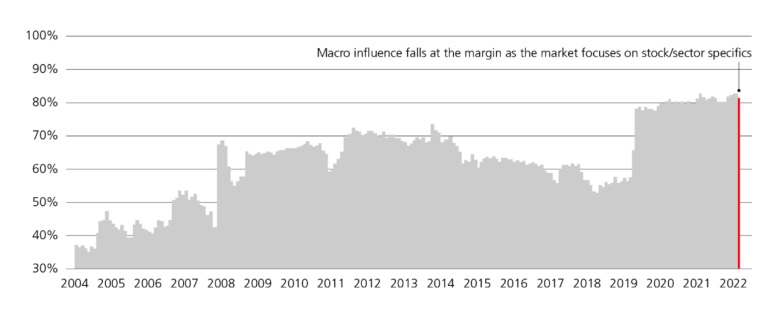
A granular bar chart from 2004 to 2022. Top-down driven market (e.g. driven by inflation, interest rates etc.) has proven difficult for bottom-up stock pickers. In the extreme short term, macro influence has fallen slightly as the market focuses on stock/sector specifics.
Short-term options dominating the option volumes
Tenor-distribution of SPX volume
Distribution of SPX notional volume by maturity
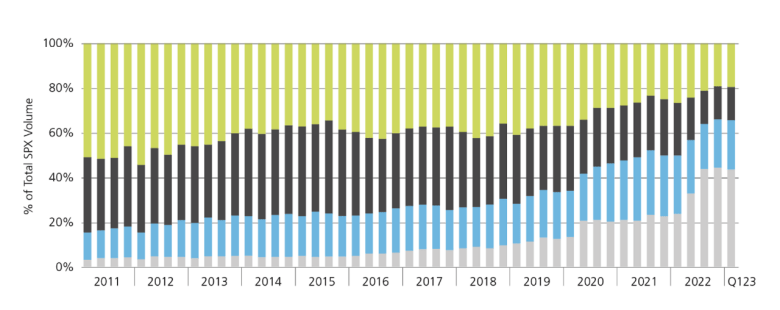
A stacked bar chart showing the distribution of SPX notional volume by maturity. A recent surge in short-term options has raised questions over whether equity prices reflect their fair value. More than 60% of S&P 500 Index Options mature in less than one week.
NB. SPX Options are exchange-traded European exercise cash settled options based on the value of the S&P 500 Index. The Standard & Poor’s 500 Index is a capitalization-weighted index of 500 stocks from a broad range of industries.
Meaningful liquidity boost by central banks
Cumulative change in central bank liquidity since 2009 (USD trillion)
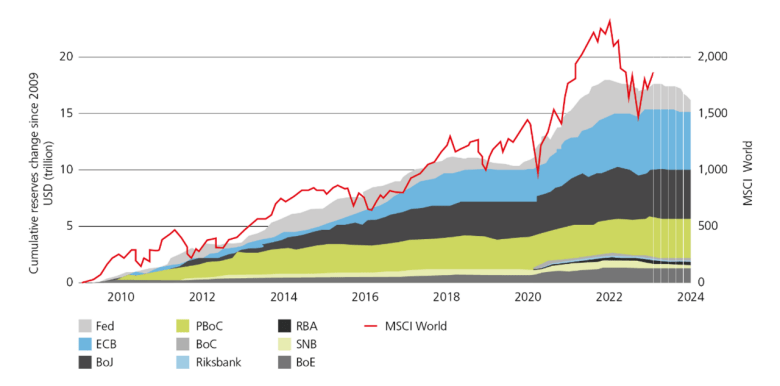
A stacked line chart showing temporary liquidity injections by different central banks increased global liquidity, despite quantitative tightening and rising interest rates. It shows the cumulative change in central bank reserves since 2009.
Global central bank liquidity change, rolling 6m (USD trillion)
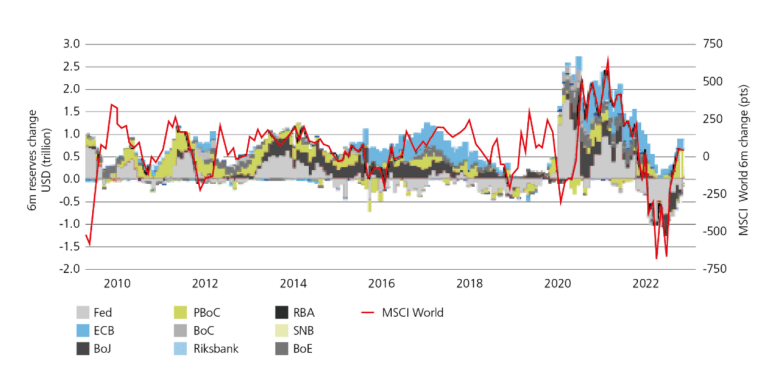
A stacked line chart showing temporary liquidity injections by different central banks increased global liquidity, despite quantitative tightening and rising interest rates. It shows the rolling six month change in central bank reserves since 2009.
The Fed balance sheet on the rise once again
Total assets of the Federal Reserve (USD millions)
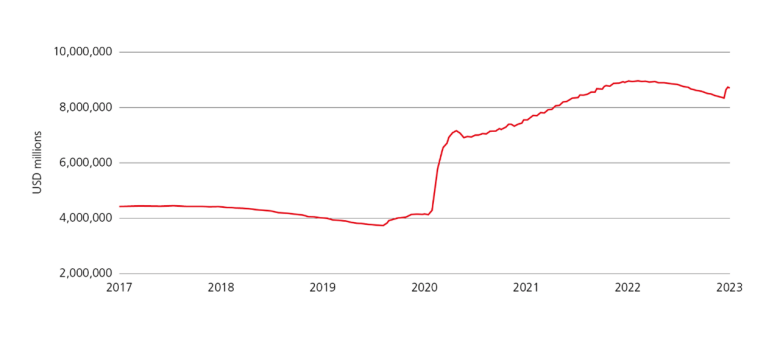
With recent events in the banking sector, the Fed has created the Bank Term Funding Program, a new facility which has led to a rapid expansion of its balance sheet. This is depicted by a line chart going back to 2017 that spikes upward in 2020 and then continues to rise slowly and steadily.
Credit creation to slow
US banking survey
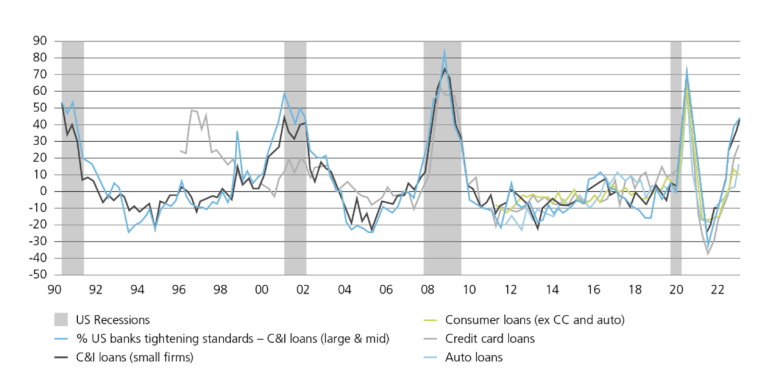
A line chart showing US banking sentiment toward small businesses, credit cards, consumer loans, auto loans and commercial and industrial loan tightening standards. The lines are all closely bunched together, covering 1990 through to the present day. Recently there has been an uptick across the board. It is overlayed by bars depicting US recessions.
US banking survey
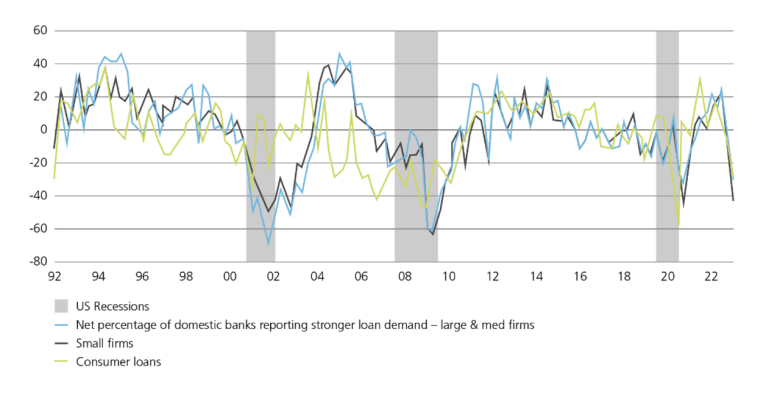
A line chart showing US banking sentiment toward small businesses, consumer loans, and loan demand within domestic banks. The lines are relatively closely bunched together, covering 1990 through to the present day. Recently there has been a sharp downtick across the board. It is overlayed by bars depicting US recessions.

