
Property investors are examining the emerging “new normal” as input into capital deployment plans for the months ahead. If history is a guide, the UK will capture a lion’s share of planned investment because its defining features remain extremely attractive despite the double trouble of Brexit and the Covid recession.
Specifically, the UK property market is the largest and most liquid outside of the US. As such it offers non-UK-based investors a means of achieving a portion of country diversification. The UK also offers superior rule of law and transparency as measured by reputable third-party surveys. At the same time, the UK has enjoyed stronger demographics compared with much of continental Europe as shown in population growth above the country median and roughly equal to the US population growth rate. These factors helped produce relatively stronger GDP growth and stronger property returns for the UK leading up to 2019 when Brexit worries became an impediment.1
With the Brexit break-up achieved, the UK is now enjoying a bounce from both Brexit uncertainty and recovery from the Covid-19 recession. We examined the beginnings of the bounce in our earlier white paper, “UK Growth Prospects Rely on the Bounce and the Silver Lining”.2 As described in that paper, the projected strength of the UK bounce is significant; the July 2021 Blue Chip Economic Survey reports a 7.0% GDP growth rate expected for the UK in 2021 and 5.2% in 2022. These projections exceed the 4.7% and 4.2% expected for the Euro Area as a whole in 2021 and 2022, respectively.
Our white paper further identified the “silver lining” of the Brexit/Covid-19 recession as the rearrangement of growth in the UK’s highly-educated workforce and in knowledge-based activity which are benefiting a number of geographies outside of London. For property investors, some of these geographies offer opportunity. In the paragraphs below, we describe how we identify the most attractive.
Drivers of CRE property demand
It goes without saying that property investment performance depends on supply and demand. During the last twenty years or so, assessing supply and demand has become less arduous as relevant data are collected and made available to investors. Over time, data collection has become more detailed, more consistent, and more geographically precise as vendors and investment advisors compete for business.
Analyzing local market data for the UK can help identify which cities potentially offer the best prospects for property investors over the next several years.3 Our research zeros in on population growth and employment growth over a five-year period as the primary drivers of demand with inventory of property in quality cohorts representing supply. Together, we believe these metrics are the primary drivers of occupancy and rent growth. We use a five-year look back period to smooth transitory quarter-by-quarter gyrations allowing us to focus on the structural trends at play in each location. Such longer-term analysis recognizes the long-horizon holding periods that are common for property investors necessitated by property’s high transactions costs.
Population level and growth rate are elementary measures of geographic attractiveness. Larger size locations can offer a wider range of amenities such as restaurants, housing stock, recreation and entertainment, education quality, etc. Larger size areas also generate “agglomeration” where businesses in a specific sector attract service business spin-offs and skilled workforce in a self-generating cycle. Moreover, larger size will generally generate more transactions and thereby offer better liquidity for investors. London is, of course, the largest city in the UK with a population of almost nine million in 2019. Following London, the Big 6 UK cities (Birmingham, Bristol, Edinburgh, Glasgow, Leeds and Manchester) range in size from 2.9 million in Birmingham to 1.1 million in Edinburgh.
Population growth is important to maintaining size. Population growth produces jobs and availability of jobs attracts more population. Stagnation is the reverse process wherein declining population shrinks employment and discourages new residents.
For the five-year period ending in 2019 pre-Covid, population growth among the 53 UK markets tracked by CoStar ranged from a 6.88% high in Coventry to a -0.34% low in Southern Scotland. Among the Big 6, Edinburgh added 5.1% to its population over the period while Glasgow added only 2.6%.
For employment growth, the leader among the 53 was Milton Keynes at 15.24% while Aberdeen lagged losing 7.9% of its jobs. Focusing on the Big 6 shows diverse performance ranging from 12.1% in Manchester to 4.6% in Glasgow.
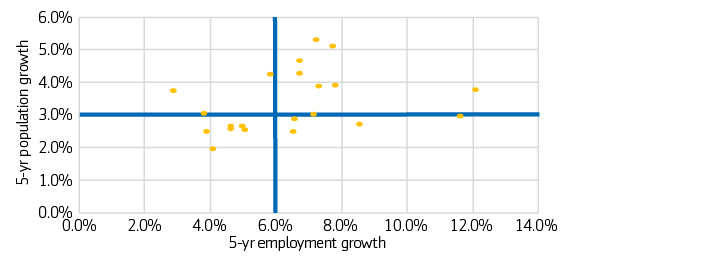
Filtering through these characteristics suggests that investors begin their market selection process with relatively larger size geographies, and with relatively stronger pre-Covid population growth and relatively stronger pre-Covid-19 employment growth among them. As an illustration, Exhibit 1 shows population growth and employment growth for the 22 geographies with population above one million in 2019. The upper right quadrant encloses the 10 “relatively stronger” localities with both relatively high population growth and relatively high employment growth. The wide blue lines represent the averages for the 22 places.
Exhibit 1: UK localities larger than one million
Assessing supply is more challenging
Data showing the stock of commercial space, leasing activity, construction flows, occupancy, and rent are not readily available from official government sources as are population and employment statistics. Supply data is collected and distributed by brokers operating in the market or specialized vendors. Limited access to data and expense related to data acquisition are some of the reasons why property investing is less liquid and less transparent than investing in stocks and bonds.
In Exhibit 2, 2019 office vacancy rates and five-year rent growth and ranks are shown for the ten localities in the upper right quadrant of Exhibit 1. Clearly, relatively strong population and employment growth along with relatively large size do not guarantee top-rank office rent growth. Even though these places rank high in those metrics, some are near the bottom in rent growth ranking. Moreover, very low vacancy rates do not point to a superlative rent growth track record either. For example, Manchester had relatively high office vacancy in the fourth quarter of 2019 but had also enjoyed very strong rent growth over the prior five years while Leicester had very low vacancy but weak rent growth.
Exhibit 2: Office vacancy rate and rent growth
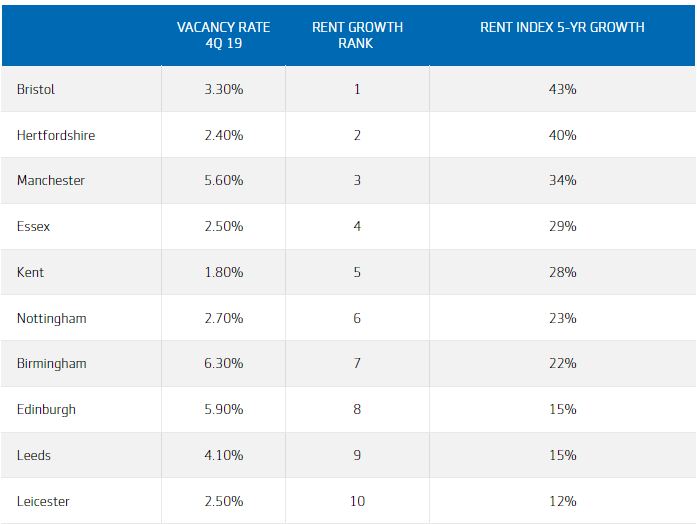
Source: CoStar Realty Information, Inc.; Aegon AM Applied Research as of June 30, 2021
In selecting markets for property investing, examination of supply should consider whether the stock of space has generally balanced demand producing attractive rent growth over time. Vacancy rates that are extremely low might reflect difficulty in adding new construction which may discourage economic growth going forward. Quality of space is also important; surges in construction can lead to gluts of high-priced space that takes time to absorb and which limits near-term rent growth. After examining these factors, investors will probably see the need to widen their targets to include markets that offer more balanced demand and supply characteristics.
Aegon Asset Management (Aegon AM) has developed an approach for addressing the challenges of market selection. We examined property market conditions across the 53 localities with detailed supply-demand data available in CoStar. This analysis focused on the state of those markets prior to the Covid-19 recession assuming that recovery from the recession would restore pre-Covid conditions. At the same time, the analysis also recognized the impact of Brexit particularly on the rearrangement of highly-educated workforce and knowledge-intense activities.
We noticed that some of the localities benefiting from relatively stronger growth in the highly-educated and in “knowledge intense business services” or KIBS activity were enjoying especially strong growth in rent on medium quality (3-star) office space over the five years ending in 2019. Such markets are dominated by 3-star office (65% of stock) because construction of new office space has been paltry at 0.4% over the five years ending 2019. As shown in Exhibit 3, the eleven localities with the most attractive supply-demand characteristics (Exhibit 4) generated 34% 3-star rent growth versus 15% for the remaining localities excluding London which separately generated 28% 3-star rent growth.
Exhibit 3: Aegon AM UK most attractive markets metrics
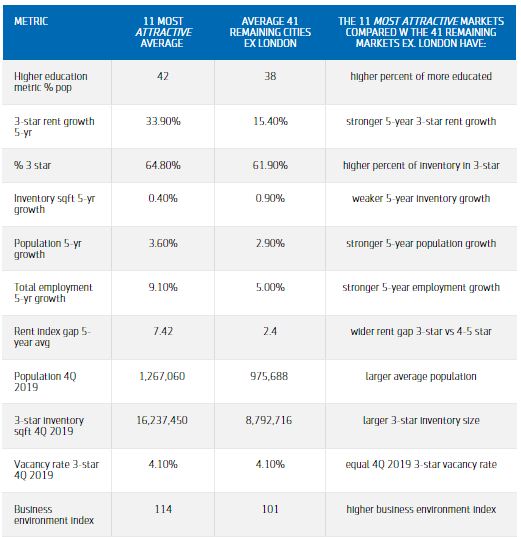
11 markets: Manchester, Birmingham, Bristol, Oxford, Cambridge, Milton Keynes, Essex, Hertfordshire, Berkshire, Nottingham, Brighton. Source: CoStar Realty Information, Inc.; Centre for Cities; Aegon AM Applied Research as of June 30, 2021
The eleven highlighted markets contain an average of 42% highly-educated population versus 38% for the remaining localities excluding London.4 This higher concentration of the highly-educated contributes to a stronger business climate in those places as shown in 114 Centre for Cities Business Environment Index versus 101 in the remaining areas excluding London. Relatively stronger population growth at 3.6% over the five-year period versus 2.9% and relatively stronger employment growth at 9.1% versus 5.1% complete the picture of relative strength.
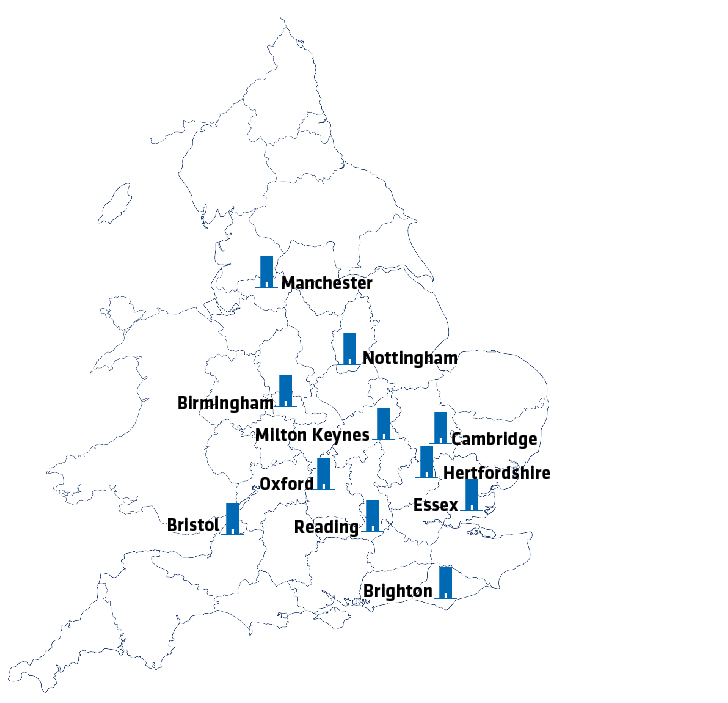
The eleven markets include three of the Big 6, Manchester, Birmingham, and Bristol, three additional markets with over one million, Nottingham, Essex (which includes Chelmsford and Basildon) and Hertfordshire (which includes Watford and St Albans) and a variety of markets smaller than one million in population with four of them (Cambridge, Oxford, Milton Keynes, and Reading-Berkshire) contained in the so-called “golden triangle” of research universities. Finally, Brighton is included despite its small size of roughly 290,000. Brighton has enjoyed stronger population and employment growth over the five years ending in 2019 than the other localities excluding London and strong growth in 3-star office rent. At the same time, Brighton’s office stock has declined due to conversions to residential use. The shrinkage left Brighton’s 3-star office vacancy rate at a rock-bottom 1.6% in 4Q 2019. While Brighton has been primarily a seaside leisure-retail area in recent years, it has also enjoyed strong start-up activity prior to the recession. As contagion abates and growth resumes, Brighton’s start-ups will need accommodations to facilitate growth.
Exhibit 4: Aegon AM UK eleven most attractive markets
The strong demand and tight supply of medium quality office space in the eleven most attractive locations along with the strong growth in rent suggests opportunity in improving and renovating the existing stock of space. These value-add activities allow for rent step-ups and prolong the useful life of the properties. In addition, the improvements can incorporate energy-efficiencies and amenities now in demand as a result of Covid-19 experiences. This analysis is further supported by the especially wide average gap of 7.4% between rent on 3-star space versus rent on highest-quality 4&5-star space. That gap is a smaller 2.4% for the other less attractive markets excluding London. Finally, the highlighted markets might benefit from potential decentralization of office activities responding to post-Covid distaste for public transportation commuting.
Conclusion
The Covid-19 lockdowns demonstrated that working-from-home can keep the office-using part of the economy functioning as long as online connections are available. In the first few months, the success of work-from-home contributed to fears that office space demand would be permanently hobbled. More recently, surveys are showing that more and more office workers are hungry to return to their offices and employers are planning to maintain much of their leased space. (The Sun, July 14, 2021).5 These findings suggest that office markets will recover occupancy and resume growth driven by the structural advantages in place prior to the recession.
References
1Aegon Asset Management, Revisiting basics for investing in real estate globally, October 2020
2Aegon Asset Management, UK growth prospects rely on the bounce and the silver lining. July 2021
3CoStar Realty Information, Inc. June 30, 2021.
4Centre for Cities, 2019
5The Sun, Half of home workers are ready to get back to the office on July 19 – but many are still worried about whether it’s safe. July 14, 2021.