A snapshot of the UK inflation market
Supply outlook
The three months to the end of August saw a meaningful flattening of the UK inflation curve. In other words, inflation expectations in shorter tenors rose more than in longer tenors and has remained sticky, despite inflation figures coming in lower than consensus forecasts in June.
It was encouraging to see core inflation finally peaking in June and July’s data, mostly from lower energy and core goods prices, though natural gas prices are projected to start rising again in January after a decline in October. Furthermore, extreme weather fluctuations and disruptions from the Ukraine / Russia war mean that volatility in commodity markets remain an ongoing feature and present upside risks to inflation.
The 2045 index-linked gilt syndication on 13 July weighed on gilt inflation around the 20-year sector pushing valuations towards the lower end of recent ranges. Looking further ahead, long-end inflation-linked gilt supply looks relatively light with only one index-linked gilt syndication remaining for the fiscal year. The nominal led sell-off has also pushed real yields to new highs, briefly exceeding 1.5% in the 2045 bond. This has supported some end-investor demand over what has been a period of historically low activity during the summer. What should encourage LDI hedging flows back into market in size is seemingly not just the outright level of real yields, but also the stabilisation of these levels – which we expect will most likely return in bond format (as opposed to swaps).
The UK Debt Management Office (DMO) announced the new issuance schedule for Q4 2023 on 31 August1. As expected, with the ten-week gap of no index-linked gilt supply between 5 December and 13 February, the final index-linked gilt syndication for fiscal year 2023/24 will take place in Q1 2024. In addition, an extra £1 billion has been transferred from the unallocated pot to the index-linked gilt syndication programme.
- A new 30-year bond – a bond maturing in 2054 would fill the maturity gap well and generate switch interest, whilst creating a future 30-year benchmark bond. We are still of the view that this is more likely due next fiscal year as the 2051 index-linked gilt is not yet at benchmark size and is still being tapped via auction. However, on balance, the addition of £1bn from the unallocated pot makes this option somewhat more likely than previously.
- Re-open tap of 2073 index-linked gilt – this bond was last issued in November 2022. There are concerns after the lacklustre performance of the previous deal that another tap would struggle, particularly if LDI demand remains tepid. Even with the increase in the cash raising target, this would only bring the deal size comparable to that of November 2022 transaction. Equally the lack of ultra longs being tapped via auction over the coming period means that, on balance, there should still be a reasonable chance of the 2073 being syndicated in Q1 2024.
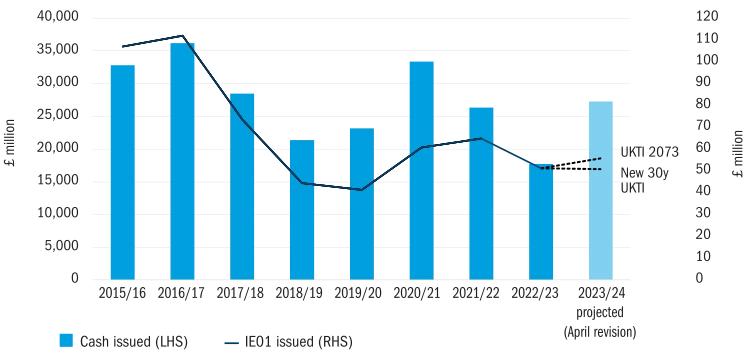
Figure 1: Inflation-linked issuance2

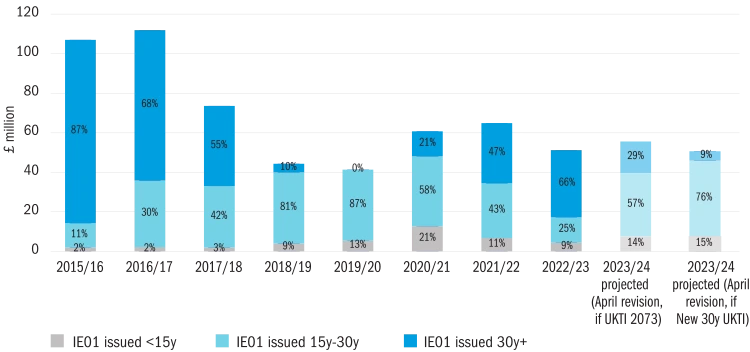
Figure 2: Distribution of inflation exposure issued, by maturity buckets

Market liquidity
Volatility over the three months to end of August was centred on shorter maturities as changing inflation data releases and unclear near-term policy outlook translated into significant moves. From the middle of August, summer illiquidity kicked in and is reflected in the widening out of transaction costs as banks will not want to warehouse risk.
At the 10, 30 and 50-year tenor points respectively, mean bid-offer spreads3 were 1.0bps, 0.9bps and 1.3bps for RPI swaps; and 1.1bps, 1.0bps and 1.3bps for index-linked gilts.
Figure 3: Liquidity tracker based on a poll of investment bank trading desks’ bid-offer spreads for RPI swaps and inflation-linked gilts (intra-day) at 10-year, 30-year and 50-year assuming trading £50k risk (IE01)
Compared to May, transactions costs in the three months to end-August increased for both RPI swaps and index-linked gilts, with the exception of 10-year RPI swaps. In contrast, both instruments experienced smaller cost dispersion across all maturities (except 50-year gilts which increased).
Gilt versus swap inflation
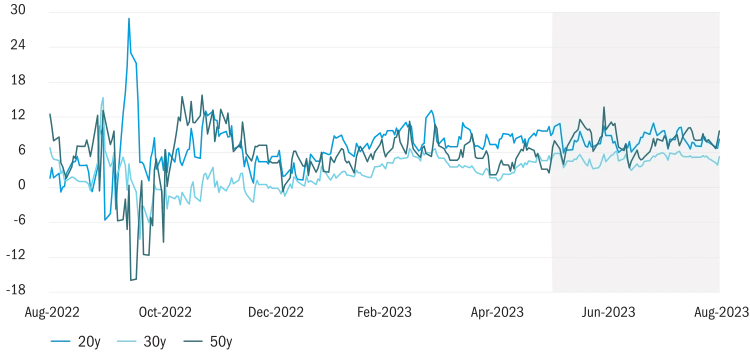
The supply outlook and bulk purchase annuity deal pipeline continued to be the main drivers of the differential between gilt and swap inflation over the three months to end-August. Over this period, swap inflation marginally outperformed gilt inflation at the 50-year tenor but underperformed at the 20 and 30-year tenors, as the relative value between the two instruments wrestled with the possibility of increased buyout flow in Q3 2023, versus the pick-up in corporate supply.
As rates look set to be “higher for longer”, pension scheme funding levels are at their all-time highs and hence the steady announcement of sizeable buyout deals in the past three months is unsurprising. Yet the usual relative value flow out of gilt inflation and into swap inflation has not come to market in the usual fashion. Firstly, instead of trading sizeable tranches in a shorter amount of time to reduce their basis risk, it appears that insurers are favouring an approach that “averages out” execution levels. This is sensible given the reduced market liquidity from net buyers of gilts not having returned in size to take the other side.
Secondly, flows from insurers have become somewhat more balanced. Insurer solvency ratios have improved materially, reducing the need for insurers to dynamically hedge the non-economic elements of their balance sheet such as the solvency capital requirements and risk margin sensitivity to interest rates.
Finally, with the cross-currency basis in the long-end less attractive at present for swapping euro and US dollar-denominated bonds back into sterling, this makes gilt alternatives (e.g. European government bonds swapped back into sterling) far less appealing.
Figure 4: Relative z-spread for generic inflation-linked bonds versus comparator SONIA z-spread (3 months to 31 August 2023 highlighted), where higher (lower) level indicates swap inflation outperforming (underperforming) gilt inflation

CPI market update
The offshore windfarm sector is also being impacted by higher capital and equipment costs. This was cited by Vattenfall4 as the key reason for its decision to shelve its Norfolk Boreas project and renege on its subsidy contract from the UK government, known as Contract for Difference (CfD5). The news may have been the motivation for some of the RPI hedging unwind that followed, which saw RPI rally in spot and in forward space on an outright basis, as well as relative to gilt inflation. This now places doubt over how much of this year’s CfD auction will be allocated to offshore windfarms given the strike price has only been set 18% higher than last year’s record low prices particularly as they also face competition from onshore wind and solar projects. This may reduce the supply of CPI swap inflation as a result.
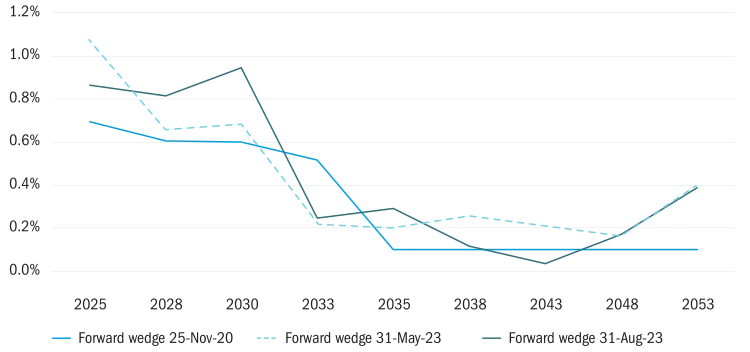
Figure 5: Indicative spread between RPI and CPI swaps expressed as a strip of forwards6, at 25 November 2020 (RPI reform announcement), 31 May 2023 and 31 August 2023

1 The UK Debt Management Office (DMO) announced the new issuance schedule for Q4 2023 on 31 August.
2 Columbia Threadneedle Investments’ assumptions for fiscal year 2023/24 are as follows –
– Cash raised based on assumption that auctions have average size ranging between £1 billion to £1.425 billion; and planned £9 billion (plus £1 billion from unallocated) to be raised over three syndications (accounting for known amounts for the UKTI 2045 syndications in April and July).
– The sizes of auctions have been extrapolated based on the auctions already planned for April to December.
– For the three syndications, the UKTI 2045 was selected for April and July but the final scheduled for later in the fiscal year is still unconfirmed.
3 These are generic market indicators and are not representative of the levels Columbia Threadneedle Investments might trade at.
4 Vattenfall press release published 20/07/2023.
5 The Government introduced the contract for difference (CfD) scheme with the objective of providing investors with certainty over new eligible projects by keeping a cap on electricity prices, for example.
6 The chart deconstructs the RPI-CPI spot wedge into a series of implied forwards, with tenors defined by the availability of data points. The first data point is the 2-year spot wedge (2023-2025), second data point is the 3-year wedge starting in 2 years (2025-2028), etc, finally ending with the ninth data point plotting the 5-year wedge starting in 25 years (2048-2053).

