

The U.S. stock market continues to record losses in 2022, and the U.S. economy shows signs that we are either in or may soon face a recession. Four charts help illustrate why we think sticking with stocks through tough times is still likely the better path forward for investors than jumping in and out of the market.
What Does a Recession Mean for Stock Returns?
While not official, there’s reason to believe the U.S. is currently in a recession. Two consecutive quarters of negative gross domestic product (GDP) growth are already in the books — a commonly cited barometer for recessions.
The National Bureau of Economic Research (NBER) makes the official call, which typically comes many months after a recession actually begins. The NBER definition includes more than GDP declines (e.g., unemployment). Despite having to wait for its version of the assessment, the market is pricing a slowdown in the economy.
For argument’s sake, let’s assume we are currently in a recession. What has that meant historically for U.S. stock returns? To explore this question, we measured returns during business cycles over the past 50 years.
NBER defines a business cycle as the period from one economic peak to the next. Between two economic peaks is a recessionary period (where the economy contracts, or a peak to trough period) characterized by a decline in economic activity and an expansionary period (trough to peak) characterized by increasing economic growth.
Our results are presented in Figure 1. We observe that the average monthly return of the U.S. market during all months, whether in recession or expansion, is just over 1% or about 12% per year. During recessions, returns have historically been slightly negative and well below the average across all months. Returns during periods of expansion have historically been positive and, at 1.20% per month, slightly above average stock returns across all months.
Figure 1 | U.S. Stocks Have Historically Underperformed in Recessions, But the Economy Is More Often in Expansion
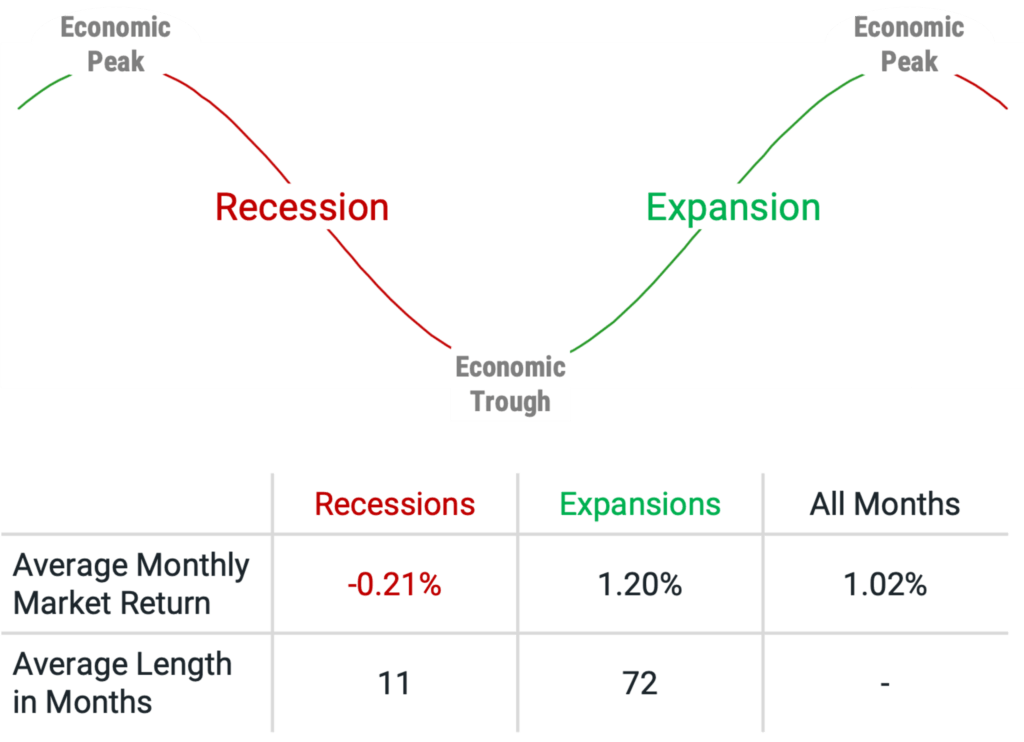
At first glance, these results may not seem encouraging in the current economic environment, but there’s more to the story. First, it’s important to consider that the U.S. economy has historically experienced growth far more often than decline. The seven recessions over the past 50 years each lasted on average around 11 months, while each expansion lasted on average about 72 months.
A deeper look at the returns during recessions reveals another interesting insight. In Figure 2, we divide recessionary and expansionary periods in half and present average monthly returns over these subperiods.
Figure 2 | U.S. Stocks Have Enjoyed Strongly Positive Returns in the Second Half of Recessions
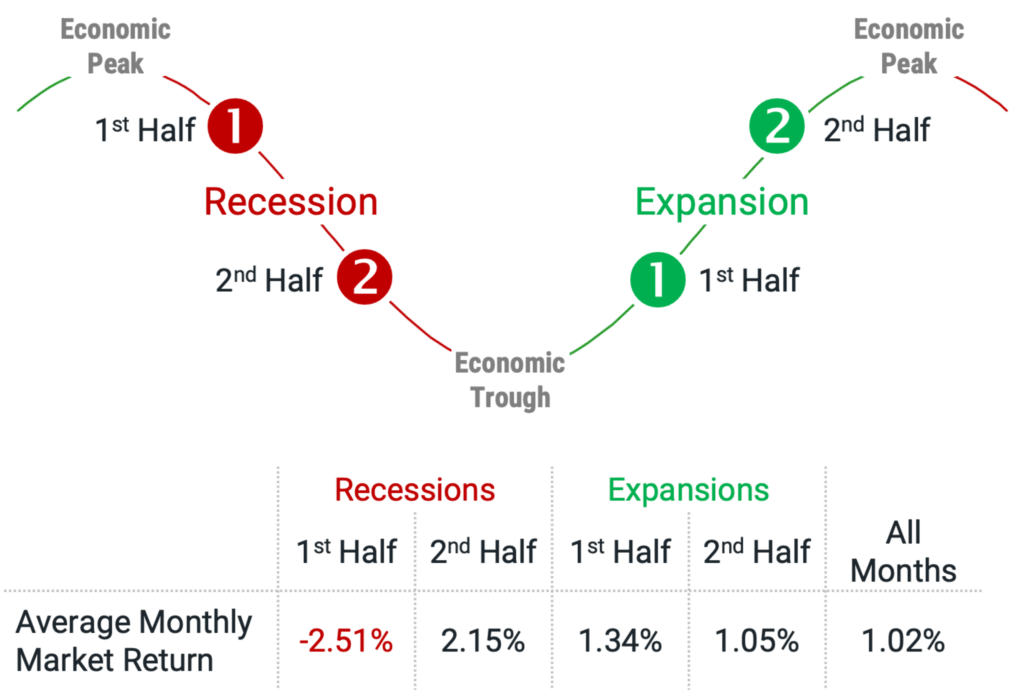
What stands out is that the below-average returns we’ve seen historically during times of recession have been driven by significantly negative returns during the first half of the recession. In the second half of recessions, returns have been strongly positive and far above the average monthly return. Good times have historically continued during the first and second halves of expansions.
What do these returns tell us? In the first half of recessions, markets react quickly to possible bad news. Expectations of lower company earnings during an economic slowdown and, more importantly, lower risk appetite due to increasing uncertainty, for example, are quickly reflected in lower stock prices.
The lower risk appetite is reflected in investors increasing their demanded discount rates¹—their expected return—for investing in risky assets (i.e., equities). That increase in discount rates for future cash flows produces a drop in prices. But, as bad news dissipates and uncertainty subsides, the market also incorporates these improving expectations.
It would be great if we could get out of the market at the start of a recession before stocks typically experience a downturn and then get back in as prices go back up. The issue is that we can’t say with certainty when economic peaks and troughs will start and end until after the fact — and trying to time these events can have detrimental effects on investors if they get it wrong.
Considering where we are today, we’ve already seen U.S. stocks decline significantly. We can’t know for sure, but it may be that we are currently experiencing the disappointing returns often seen during the first half of recessions. The market seems to have already priced in a lot of bad news and the potential for turmoil.
The risk of fleeing the market today is that investors may leave when the bad news is priced in and miss out on the historically positive returns typically seen in the second half of recessions.
What Has Recession Meant for Small Value-Focused Investors?
Investors may also wonder how stocks with different characteristics or in different asset classes perform throughout business cycles to understand how a particular focus in their portfolios might affect outcomes during and after recessions.
We find that a focus on companies with lower valuations has historically fared better than the market over the long-term, but the difference has been especially meaningful following the poor returns historically exhibited during the first half of recessions.
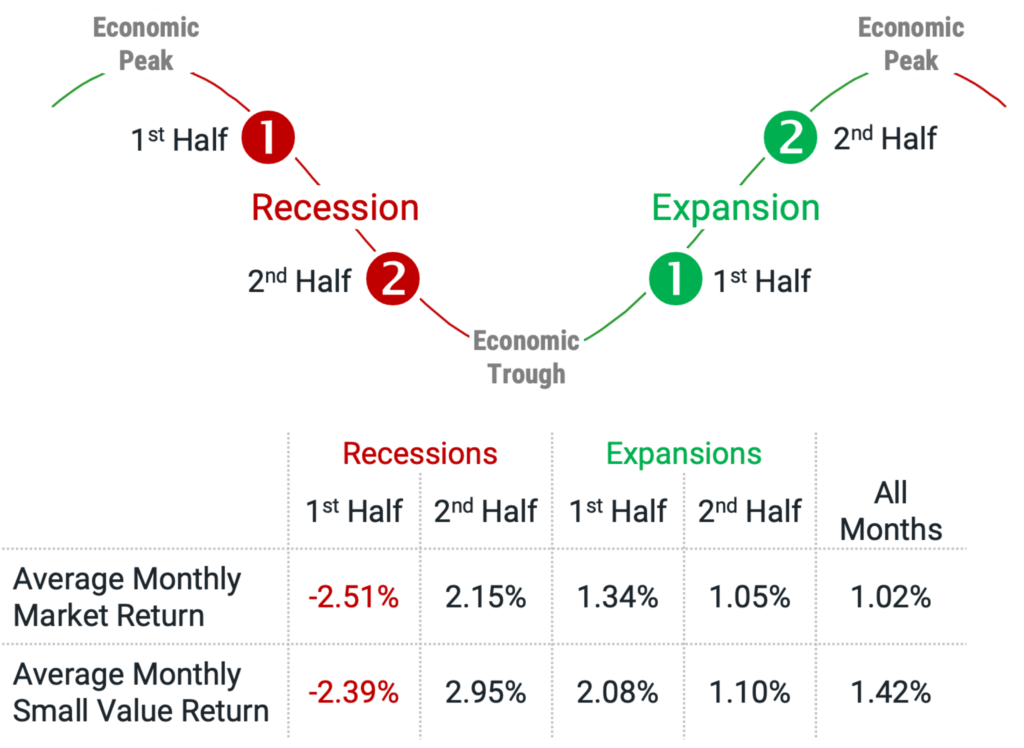
In Figure 3, we show the returns of traditional value (low price-to-book) stocks within small caps during the business cycle periods shown in Figures 1 and 2. We see that small value stocks have exhibited higher returns than the market, dating back to 1973. Over the first half of recessions, when we have historically seen sharply negative returns for U.S. stocks, small value stocks declined to a lesser degree than the total market.
Over the second half of recessions and during the first and second halves of expansions, small value stocks again outperformed the market during each period. Notably, the returns for small value stocks have, on average, been much higher than the market in the second half of recessions and the first half of expansions.
This tells us that valuations matter whether the economy expands or contracts. In the periods following the first half of historical recessions, valuations have mattered quite a lot.
Figure 3 | Lower-Priced Stocks Have Historically Fared Better Than the Market in Recessions and Expansions
Don’t Lose Sight of the Destination
While it is normal to look for insights from historical periods that seem similar to what we face today, we do not want to lose sight of the bigger picture. In Figure 4, we plot U.S. real GDP, which accounts for the effects of inflation to make different periods comparable, and the growth of $1 invested in the U.S. stock market from 1947 through 2021.
Figure 4 also shows drawdowns for U.S. stocks over time, which is the negative performance from the market’s previous peak. This shows that, while the long-term growth of wealth line appears smooth, if we magnify periods of decline, we can see that the experience for investors is not always so smooth.
Figure 4 | The Economy and Stock Market Have Overcome Many Rough Periods Throughout History
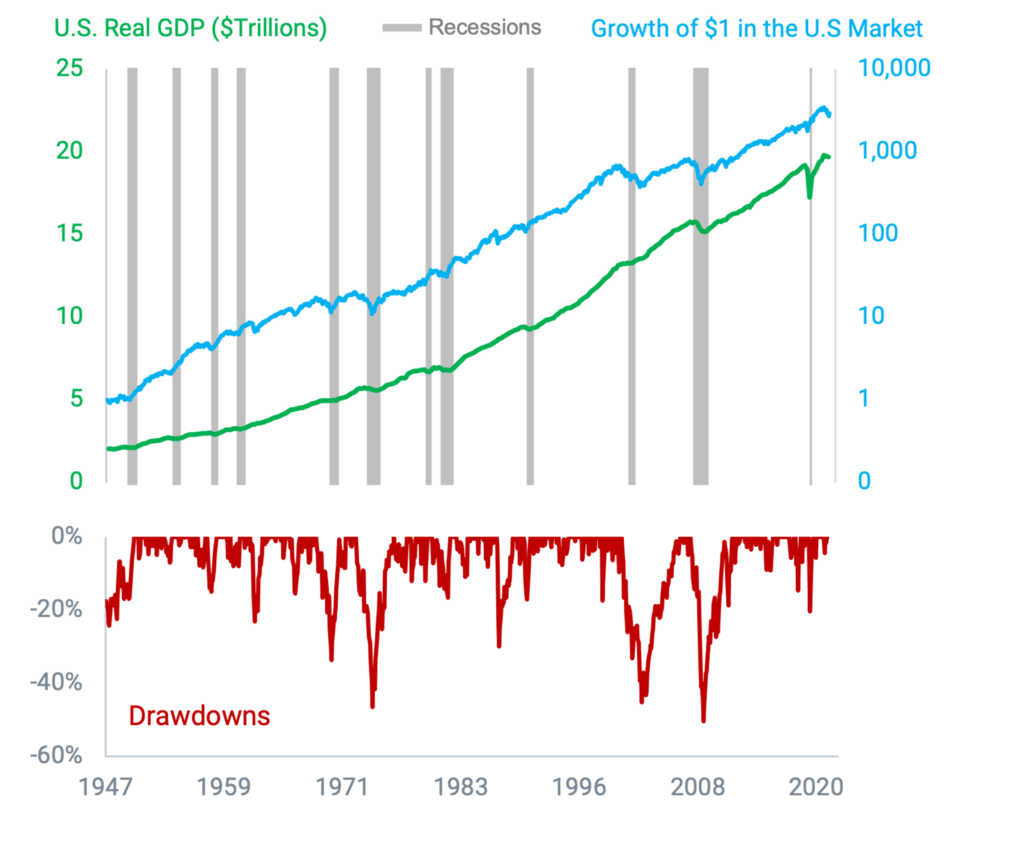
Over the long term, the U.S. economy has overcome many recessions, shown as shaded periods in Figure 4, and despite these short-term bumps along the way, has time and again recovered and experienced tremendous growth in GDP.
U.S. stocks have also been a powerful driver of long-term growth despite market drawdowns. The long-term results demonstrate that investors who have stuck with stocks through the tough times have historically been rewarded.
Market downturns are like traffic lights. When we drive, we may be slowed by red lights, but that doesn’t prevent us from proceeding to our destination. If we choose not to drive to avoid being stopped at red lights, we can’t get to where we want to go.
Similarly, if we stay out of the market to avoid downturns, we may not reach our financial goals. So, it’s important to practice patience and learn to manage in times of uncertainty. Keeping a focus on the long-term destination can help.
1Discount rate: The rate used to reflect the time value of money and calculate the present value of a future stream of expected cash flows in a discounted cash flow (DCF) analysis.
The opinions expressed are those of American Century Investments (or the portfolio manager) and are no guarantee of the future performance of any American Century Investments’ portfolio. This material has been prepared for educational purposes only. It is not intended to provide, and should not be relied upon for, investment, accounting, legal or tax advice.
This information is for educational purposes only and is not intended as a personalized recommendation or fiduciary advice. There are different options available for your retirement plan investments. You should consider all options before making a decision. Our representatives can help you evaluate all of your distribution options.
Investment return and principal value of security investments will fluctuate. The value at the time of redemption may be more or less than the original cost. Past performance is no guarantee of future results.
Diversification does not assure a profit nor does it protect against loss of principal.
It is not possible to invest directly in an index.