
Key Takeaways
- WisdomTree Quality Growth UCITS Index acts as a possible proxy for growth in the US market compared to other strategies that select stocks based on market capitalisation and listing exchange.
- WisdomTree Quality Growth UCITS Index takes a holistic approach to index construction by selecting stocks based on fundamentals.
- The top five non-overlapping stocks in WisdomTree Quality Growth UCITS Index have historically had considerably higher average estimated growth and higher average sales growth compared to the top five non-overlapping stocks in the Nasdaq-100 Index.
The Nasdaq-100 Index is considered by many as the default benchmark for growth.
The methodology is straightforward—the 100 largest non-financial companies by market-cap listed on the Nasdaq Exchange are selected for inclusion. Securities are weighted by modified market capitalisation.
One of the possible drawbacks to this simplicity for a growth benchmark is that mature, slow growth companies can populate the index because of the absence of fundamental selection criteria.
In our view, WisdomTree has created a better way to capture growth—the WisdomTree U.S. Quality Growth Index. Since its launch near the end of 2022, it has outperformed the Nasdaq-100 while being more directly targeted to high-growth, high-profitability companies.
Cumulative index total returns since 30 November 2022
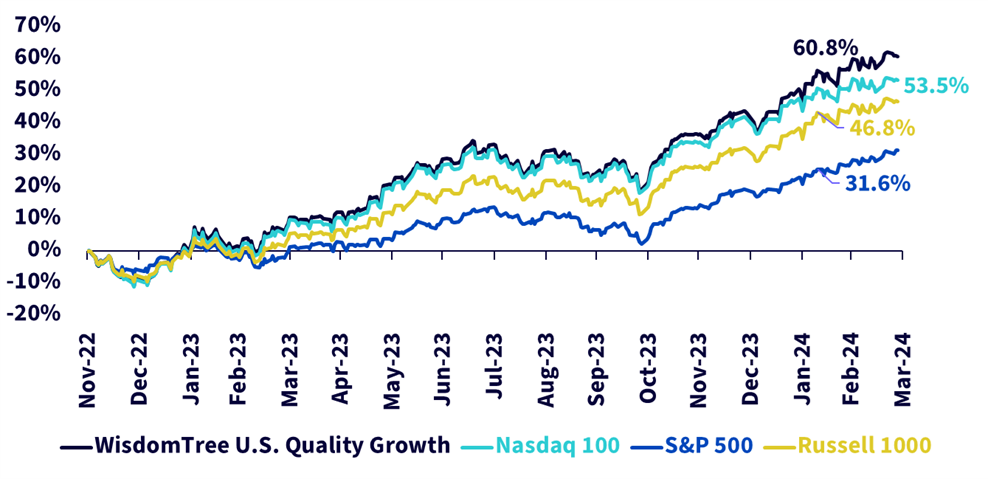
Source: WisdomTree, Russell, Nasdaq, S&P, 30/11/2022 – 29/3/2024. You cannot invest directly in an index. Historical performance is not an indication of future performance and any investment may go down in value.
The returns for both the WisdomTree U.S. Quality Growth Index and Nasdaq-100 have, unsurprisingly, benefitted from a positive market backdrop for growth over the last 16 months.
The UCITS version of the index discussed below, called the WisdomTree U.S. Quality Growth UCITS Index, tracks the WisdomTree U.S. Quality Growth Index closely with a tracking error of just 0.2%.
WisdomTree U.S. Quality Growth UCITS Index reconstitutes on a semi-annual basis each June and December, refreshing its exposure to companies with the fundamental characteristics of high profitability and high growth. The Nasdaq-100 Index on the other hand reconstitutes once per year.
Like the Nasdaq-100, the WisdomTree Index selects 100 securities. The indices hold 37 securities in common with a common holdings score (or overlap) of 58%.
WisdomTree U.S. Quality Growth Index and Nasdaq-100 Index (benchmark) holdings overlap
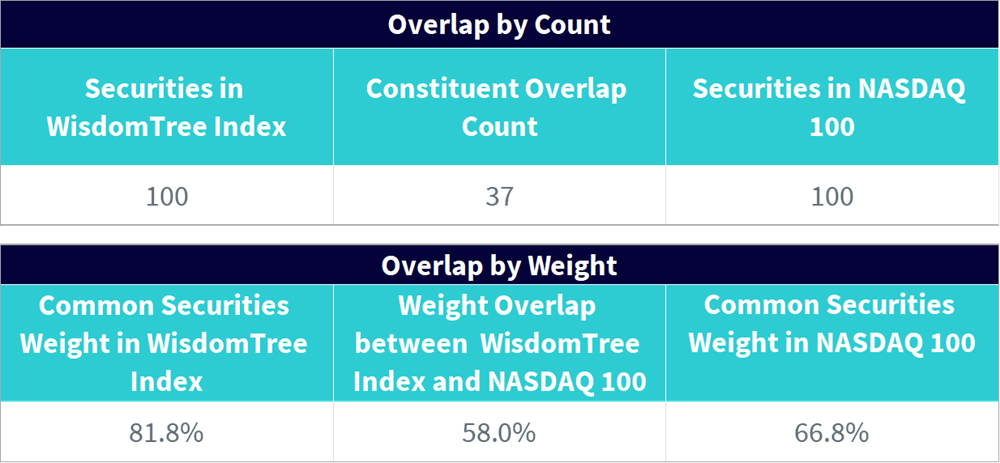
Source: WisdomTree, Nasdaq, as of 29/3/2024. You cannot invest directly in an index.
To illustrate the emphasis on earnings growth/sales growth characteristics for the WisdomTree Index and how this differs from the traditional approach, we highlight two sets of companies in the below chart:
- Light blue dots: Five largest holdings in the WisdomTree U.S. Quality Growth UCITS Index that are not included in the Nasdaq-100 due to listing on the New York Stock Exchange:
- Mastercard, Visa, UnitedHealth Group, Blackstone, ServiceNow
- Dark blue dots: Five largest holdings in the Nasdaq-100 that are not included in the WisdomTree U.S. Quality Growth Index (due to profitability/growth screens):
- Costco Wholesale, PepsiCo, Broadcom, Cisco Systems, T-Mobile US
A few observations from this illustration:
- Historically, the average earnings and sales growth for companies included in the WisdomTree Index but excluded from the Nasdaq-100 is 17.1% and 14.0% respectively. The standard deviation of earnings growth of these companies is just 3.7%.
- Historically, the average earnings and sales growth for companies included in the Nasdaq-100 but excluded from WisdomTree Index is 11.7% and just 9.0% respectively. The standard deviation of earnings growth of these companies stood much higher at 6.4%.
- ServiceNow, an over $150bn market capitalisation company, provides a good example of the type of fast-growth company excluded from the Nasdaq-100 because of its listing on the NYSE—it has grown sales 28% annualised over the last five years, and is projected by analysts to grow earnings by over 20% in the next several years1.
- Cisco Systems, on the other hand, has grown its sales at just 4% annualised and analysts expect earnings growth of less than 5% going forward. Though not a growth company based on traditional fundamental metrics, the company is included in the Nasdaq-100 because of its market cap and its listing on the Nasdaq2.
Growth characteristics
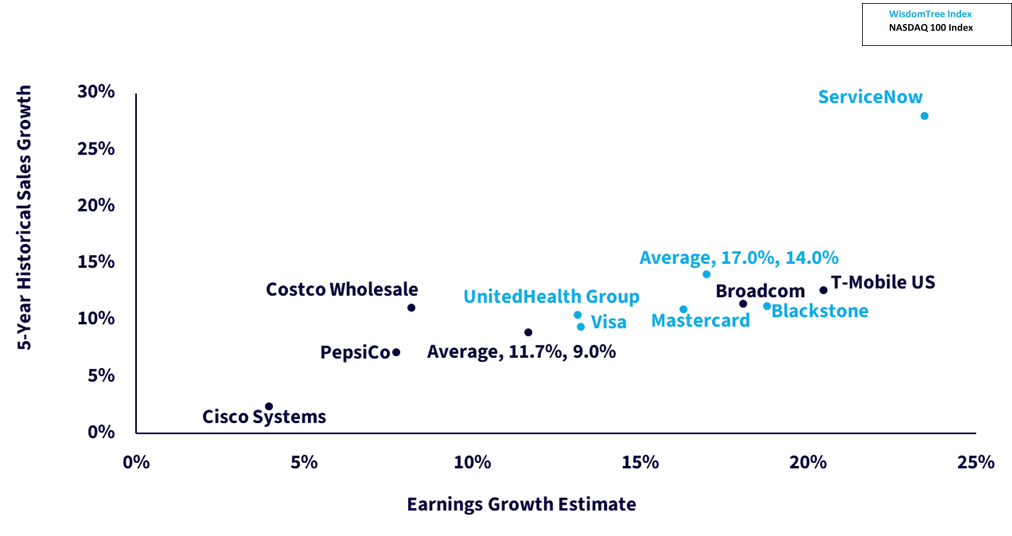
Source: WisdomTree, Nasdaq, FactSet, as of 29/3/2024. Earnings growth estimate based on median analyst earnings growth estimates over the next 1–3 year period. Dark Blue dots relate to companies included in the Nasdaq 100 that are not included in the WisdomTree U.S. Quality Growth Index. Light Blue dots relate to companies included in the WisdomTree U.S. Quality Growth Index that are not included in the Nasdaq 100. You cannot invest directly in an index. Historical performance is not an indication of future performance and any investment may go down in value.
Conclusion: a different approach to growth - the WisdomTree U.S. Quality Growth UCITS Index
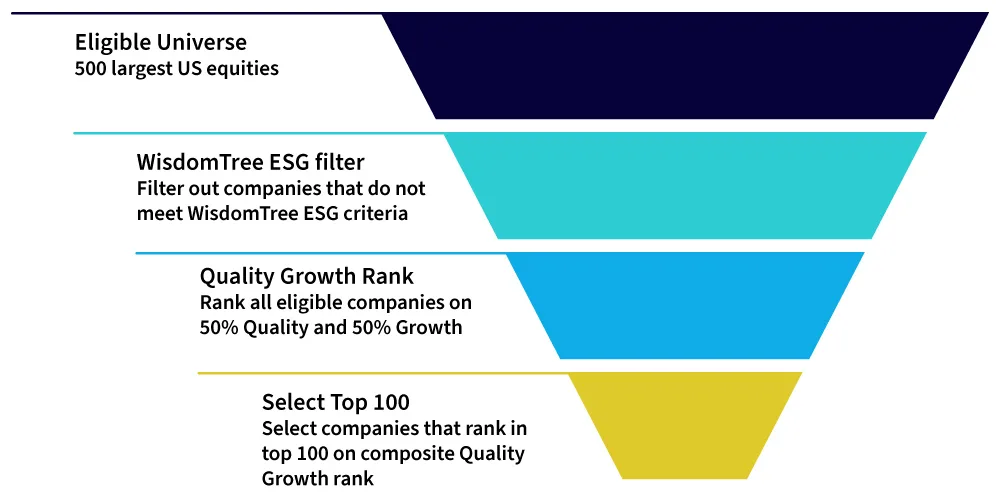
The WisdomTree U.S. Quality Growth UCITS Index is a market-cap weighted index that consists of companies with quality and growth characteristics. The top 500 US companies which satisfy the WisdomTree ESG criteria and are listed on any of the major US exchanges by market capitalisation are ranked on a composite score of two fundamental factors: growth and quality, which are equally weighted.
The Index is comprised of the 100 US companies (the first quintile) with the highest composite scores.
Growth factor: The growth factor is determined by a company’s ranking based on a 50% weight in its median analyst earnings growth forecast, a 25% weight in its trailing five-year EBITDA3 growth and a 25% weight in its trailing five-year sales growth.
Quality factor: The quality factor is determined by a company’s ranking based on a 50% weight to each of its trailing three-year average return on equity and trailing three-year average return on assets.
Investment process
| Rebalance frequency/weighting/caps |
| Semi-annual rebalance (June and December) Market-Cap weighted Individual Security Caps (15%) |
Conclusion
We believe that by taking a more holistic approach to index portfolio construction with selection based on fundamentals, the WisdomTree Quality Growth UCITS Index could provide investors with a better proxy to growth. This approach allows the WisdomTree Index to have exposure to high quality and high growth stocks in the portfolio and look to avoid speculative stocks which could be vulnerable to higher drawdowns.
Sources
1 Source: WisdomTree, Nasdaq, FactSet, as of 29/3/2024.
2 Source: WisdomTree, Nasdaq, FactSet, as of 29/3/2024.
3 Earnings before interest, taxes, depreciation and amortization.