
Resilient growth data has seen equity markets record a strong start to this year and while the stock market rally has paused for breath over recent weeks, we remain positive on the asset class.
Going into this year, a global recession was the base case for many economists and market participants. However, despite underwhelming reopening recovery from China, the global economy has been resilient to the environment of rapidly rising rates. Our proprietary global growth lead indicator, which had been improving from last Autumn, has this week turned positive for the first time in nearly two years, with US business confidence notably improving. We believe that this positive global economic growth momentum could provide further support for equities to continue their outperformance over bonds (Chart 1).
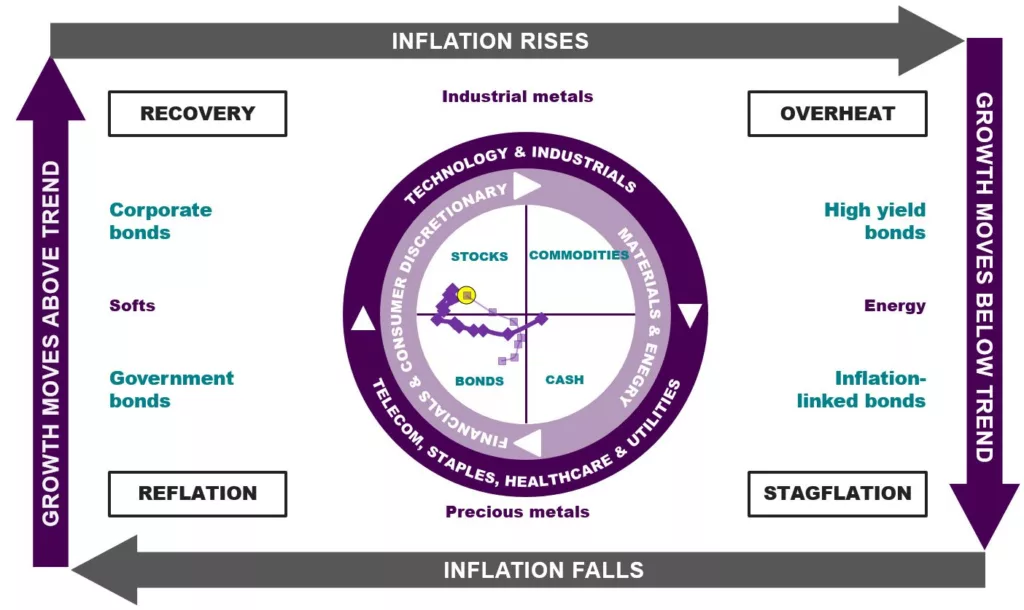
The improvement in the global growth backdrop coincides with further evidence of peaking inflation. This dynamic sees the latest update of our Investment Clock remaining in the Recovery quadrant, which is historically the best phase of the business cycle for investing in equities (Chart 2).
As we move forward, we recognise that a more defensive positioning may be required later in the year, should inflation remain stubbornly high and necessitate continued tighter policy until it damages the growth picture. This could see our Investment Clock drift into the Reflation quadrant where government bonds typically outperform.
Chart 1: Leading growth indicator and equities vs bonds
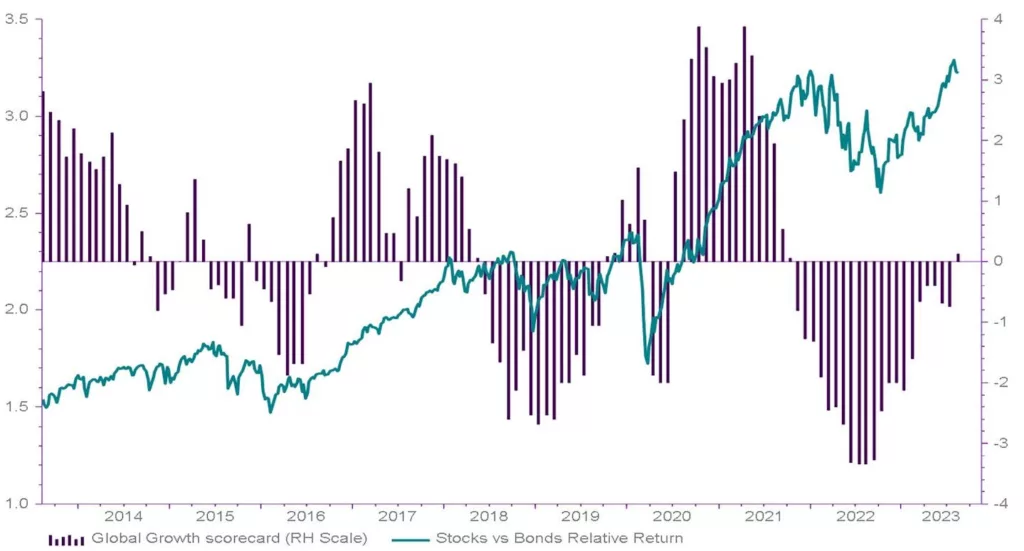
Chart 2: Investment Clock is in Recovery
Market summary
Global equities ended slightly lower over the week, with underlying components mixed. Emerging market and Asia Pacific shares led losses amid disappointing trade, credit data and worries of deflation in China. Elsewhere tech stocks also struggled amid rising real yields. US 10-year yields rose to their highest level in nine months while UK 10-year yields rose to 4.5% as July GDP beat expectations. Elsewhere, oil prices continued to move higher, locking in a seventh consecutive week of gains to reach nine-month highs at $86/barrel.
Economics summary
US Consumer Price Index data confirmed that inflationary pressures are easing in the US, however Producer Price Index was stronger than expected. UK GDP growth beat expectations over June but benefitted greatly from the extra bank holiday in May. Central bankers continued with a broadly data-dependent messaging.
This is a financial promotion and is not investment advice. Past performance is not a guide to future performance. The value of investments and any income from them may go down as well as up and is not guaranteed. Investors may not get back the amount invested. Portfolio characteristics and holdings are subject to change without notice. The views expressed are those of the author at the date of publication unless otherwise indicated, which are subject to change, and is not investment advice.