
Past performance is not a guide to future performance. The value of an investment and the income generated from it can fall as well as rise and is not guaranteed. You may get back less than you originally invested.
The Liontrust Strategic Bond Fund returned -1.4%* in sterling terms in May. The average return from the IA Sterling Strategic Bond sector, the Fund’s comparator benchmark, was -1.1%.
Financial markets’ attention was firmly focussed on the negotiations surrounding the US debt ceiling in May. As confidence grew that a deal would be struck, sovereign bond yields rose; we took advantage of these better valuations to lengthen the Fund’s duration further. In this commentary we comment upon the US debt ceiling, economic fundamentals, and give an update on Fund positioning and activity.
US debt ceiling
The debt limit was formally raised under the Fiscal Responsibility Act (FRA) 2023. It passed votes in the House and Senate, and Biden signing it into law on the weekend. There was a huge range in outcomes of spending cuts between zero and $4.5 trillion over the next decade. The Democrats say that the FRA only amounts to $1 trillion of cuts, the Republicans argue that it is $2 trillion, and the non-partisan Congressional Budget Office (CBO) say $1.5 trillion so I’d be inclined to go along with that. Obviously, it is subject to changes during budgeting processes and the forecasts after the first couple of years are very much trajectory based anyway.
The reduced spending is across four main categories:
1. Two years of spending caps (this is by far the largest contributor).
2. Rescinding unspent Covid funding.
3. Some modifications in work requirements for programs such as SNAP and TANF (Supplemental Nutrition Assistance Program, Temporary Assistance for Needy Families).
4. Reforms to energy permits.
The cuts to federal spending in fiscal year 2023 are negligible, with about $65 billion expected in 2024 according to the CBO (note fiscal 2024 starts in Q4 2023), or roughly 0.25% of GDP. To put this in context, after the debt ceiling debacle in 2011 the fiscal contraction was 0.7% of GDP. Additionally, the moratorium on student loan payments will end in August (this was in the FRA but expected to happen anyway), a small headwind for consumption later this year.
The debt limit will be suspended until 1st January 2025. In my opinion, this is a poor choice of date as it will be in the period between the next US election and inauguration. Unless one party achieves a clean sweep of the Presidency, House and Senate in the elections we will be back in the same situation with all the post campaigning animosity simmering along too. Once the debt limit is reinstated, it will be at the current level plus the cumulative increase in obligations between now and 1st January 2025. It will not be instantly binding as the Treasury can start using extraordinary measures again to delay the new X-date.
More imminently, one should expect a flood of US Treasury Bill issuance as the US Treasury looks to rebuild its liquidity from its $48 billion end-May level. I anticipate at least $500 billion of net supply; whether this drains liquidity and reserves from the financial system depends upon who the buyer of the T Bills is. The most natural buyer would be money market funds which have been attracting large inflows due to higher rates and the US regional banking crisis, total assets standing over $5.8 trillion. A good chunk of the inflows has effectively been parked with the Federal Reserve using their Reverse Repo Facility (RRP); although they are not the only market participants with access to the RRP they will make up a decent percentage of the $2.25 trillion usage. To entice money market funds to buy, the yield on the T Bills will need to be above that on the RRP, probably plus a little more to compensate for the smidgeon extra duration. Any T Bills bought by domestic investors other than the money market funds will be a drain on US financial system reserves. This will bring forward the date at which the Fed stops its quantitative tightening (QT) programme as reserves reduce towards the level which the Fed deems to be ample (probably somewhere in the $2-2.5 trillion range).
Economic fundamentals
With the debt ceiling suspended until January 2025, bond market attention has shifted back to economic fundamentals. Starting in the US where inflation is too high but heading in the right direction, consumer price inflation (CPI) data snuck in below expectations at 4.9% (consensus 5.0%, prior 5.0%) with core CPI meeting expectations of a small decrease at 5.5% (consensus 5.5%, prior 5.6%). Goods prices have been surprisingly strong in the first quarter of 2023. In the April data (released in May) there was another upside surprise, but this was caused entirely by used car prices which jumped up by 4.4% during the month; I expect this erratic item to fall back down again soon. Excluding used car prices, core goods prices were flat on the month; I attribute this to the continued easing in supply side constraints coupled with reduced PPI (producer price inflation), and a retrenchment in some excess profit margins within the supply chain. I expect goods prices to re-enter disinflationary territory in the second half of the year. Within services. the monthly rent figure – rents and owners’ equivalent rents – was around 0.5% again at 0.56% and 0.54% respectively; this is below the run rate of 0.7% – 0.8% seen around the turn of the year. One of our key messages on inflation is the methodological lag in these shelter items; it is reassuring to see the inflationary pace start to decline and there will inevitably be a lot more to come in the second half of 2023. Most importantly, core services ex-housing was only up 0.1% in the month (the lowest since July 2022); this is likely to be a little higher over the coming months, but the huge improvement will be a relief for the Fed. It is core services ex-housing that is most correlated to nominal wage inflation, hence why Powell et al have been so keen to see this measure, one of the ones they can easily exert influence over with monetary policy, decrease. The detail was supportive of a declining trajectory in inflation.
Unemployment tends to occur very late into the economic cycle and presently the labour market remains remarkably robust. The JOLTS data was strong with openings back above 10 million at 10,103k (consensus 9,400k, prior 9,745k). The only silver lining was the quits rate falling again, ticking down to 2.4%. Headline nonfarm payrolls were 339k (consensus 195k, prior 294k) with private payrolls of 283k (consensus 165k, prior 253k); those are the bits that the bit that the Fed and bond market won’t like. However, there was also some good news for bonds in the data. Average hourly earnings decreased to 4.3% (consensus 4.4%, prior 4.4%), but do note this does not adjust for the mix effect; weekly hours reduced to 34.3 (consensus 34.4, prior 34.4). Importantly, the unemployment rate overshot at 3.7% (consensus 3.5%, prior 3.4%), with underemployment ticking up 0.1% to 6.7%. Although the payroll figures were slightly bearish for bonds, I do not believe the strength is uniform enough to persuade undecided Fed voters to turn hawkish. A pause (or “skip” as it is now often being called) in rate hikes at the June meeting is still the most likely scenario. The market is pricing a 40% probability of a 25bps hike in June. Continued strength in data could tip the Fed into hiking again in July (hence the skip language), the market is pricing in over 80% probability of an increase.
Eurozone inflation figures for May are also a little encouraging. Inflation figures undershot expectations with CPI at 6.1% (consensus 6.3%, prior 7.0%) and core CPI 5.3% (consensus 5.5%, prior 5.6%). Energy inflation was -2.2% in May, taking the annual figure back into negative territory at -1.7%. Inflation in food, alcohol and tobacco remains high but has come off its top and should start to fall faster over the coming months. Core goods continue to see inflation fade, dropping by 0.4% to a rate of 5.8%. The all-important services inflation also reduced, this time by 0.2% to 5.0%. This was slightly flattered by the new German transport subsidies; the subsidies are not as large as last year so base effects mean services inflation will rise a little over the summer, but the underlying trend now seems to have stabilised. The trajectory of the overall figures will please the ECB, but the absolute level is still too high for victory over inflation to be declared. My central case of the ECB undertaking two more 25bps hikes to reach a terminal rate of 3.75% remains the same, but the right hand tail risk of further tightening beyond this has slimmed significantly post these inflationary figures.
Finally, the UK inflation data was dreadful, pretty much defining “persistent pressures” and will force the Bank of England to overshoot further in its tightening cycle. Headline CPI fell to 8.7% (consensus 8.2%, prior 10.1%) but core CPI increased to 6.8% (consensus 6.2%, prior 6.2%). The fall in the headline figure into single digit territory is about the only good news. The strength in core inflation figures was alarming; Gilts have hugely underperformed other developed markets during May as a result of this.
Electricity and gas prices knocked 1.4% off annual inflation, largely as last April’s rise dropped out of the 12-month figure; it still added 1.0% to annual inflation. Given the decrease in the Ofgem price cap announced during May, energy’s contribution should fall by around another 0.8% in July. Food inflation was down 0.1% but still at very high levels, with 19.2% in the year to March 2023, compared to 19.1% in the year to April 2023; disinflation should start soon assuming wholesale price decreases are passed through to the consumer. April’s CPI figures include a number of items (rents, phone bills, etc) that are linked through CPI clauses to past inflation, the upside surprises were in other goods and services. Within goods, one of the highlights/lowlights was used car prices rising, but the overall upside was widespread. Similarly, services witnessed an increase in inflation from 6.7% to 6.9%. This latter measure is the one that will concern the Bank of England most. It is the one that monetary policy should be able to exert significant influence over. As a reminder, the MPC’s latest statement included the line “…If there were to be evidence of more persistent [inflationary] pressures, then further tightening in monetary policy would be required”. These figures definitely showed persistent inflationary pressures so a June rate rise should be a certainty; the only debate is whether they revert back to a 50bps increment (I don’t think they will, but never have high confidence in Bailey’s guidance). The market is now pricing for 100bps of cumulative further tightening to take peak rates to 5.50% in November.
I do think a lot of the inflationary problems we are now seeing are lagged effects of previously inappropriately loose monetary policy compounding the impulse created by supply chain problems. The restrictive rate environment now in place will lead to falls in inflation; once a recession starts the inflationary fall will accelerate. Unfortunately, previous mistakes are going to be compounded by the Bank of England being forced into overshooting on the upside, albeit I doubt they will reach 5.50% base rates. In my opinion this represents an opportunity to buy UK duration exposure, but given sticky core inflation and an unpredictable central bank (and in October 2022 reckless Government), it will be a volatile path to lower long-term yields.
Fund positioning and activity
Rates
The Fund started the month with 5.5 years of duration exposure and we used the weakness in sovereign bonds during May to build up to a meaningful strategic long duration position. The Fund now has 7.25 years of exposure, well above its neutral level of 4.5 years, but we retain a little headroom below our 9-year maximum. The geographic split of the exposure is 2.75 years in the US, 0.5 years in New Zealand, 2.25 years in the UK, and 1.75 years in the Eurozone. Within the latter there is 0.5 years of French duration exposure as the yield spread between France and Germany is at attractive levels.
The Fund retains a yield curve steepening position; net duration exposure in the 15+ year maturity bucket is zero. As base rates plateau and then, eventually, begin their descent, we should see a significant steepening in yield curves; short-dated bonds will see yields rally more than very long maturities.
Allocation
There was no significant change to asset allocation during May. Investment grade exposure is just above 50%, and net high yield exposure is just below 20%; both are very close to neutral levels. There is good long-term value in credit, but with the tensions between rate rises and recessionary risk there will inevitably be further volatility in credit markets. If credit spreads widen enough to make valuation levels become very compelling again, then we will increase allocations significantly.
Selection
One new investment grade purchase during May was a Tier 2 bond issued by Allianz. The bonds have a 30-year maturity and are callable after 10 years; to compensate for this structure, one is paid a significantly higher credit spread. Also, the new issue launched and priced on a Friday which maybe did not galvanise as much investor attention as it would have received on other days; I’m not complaining as it benefits us. Overall, a €5.824% coupon for this single-A rated instrument offers compelling long-term value.
Within the Fund’s high yield holdings, we exited the position in Catalent. A rapid succession of profit adjustments and delays to its reporting raised governance concerns for us. Longer term, we still like the fundamentals of the business, but we want to be able to gain confidence in the robustness of its financial statements before we would feel comfortable buying back into the bonds.
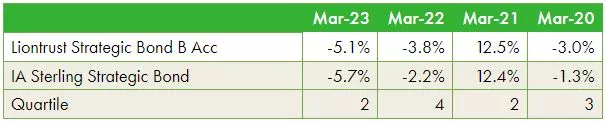
Discrete 12 month performance to last quarter end (%)**:
Past Performance does not predict future returns
*Source: Financial Express, as at 31.05.2023, accumulation B share class, total return (net of fees and income reinvested.
**Source: Financial Express, as at 31.03.2023, accumulation B share class, total return (net of fees and income reinvested. Discrete data is not available for five full 12-month periods due to the launch date of the portfolio (08.02.18).
Fund positioning data sources: UBS Delta, Liontrust.
†Adjusted underlying duration is based on the correlation of the instruments as opposed to just the mathematical weighted average of cash flows. High yield companies’ bonds exhibit less duration sensitivity as the credit risk has a bigger proportion of the total yield; the lower the credit quality the less rate-sensitive the bond. Additionally, some subordinated financials also have low duration correlations and the bonds trade on a cash price rather than spread.
KEY RISKS
Past performance is not a guide to future performance. The value of an investment and the income generated from it can fall as well as rise and is not guaranteed. You may get back less than you originally invested.
The issue of units/shares in Liontrust Funds may be subject to an initial charge, which will have an impact on the realisable value of the investment, particularly in the short term. Investments should always be considered as long term.
Investment in the Strategic Bond Fund involves foreign currencies and may be subject to fluctuations in value due to movements in exchange rates. The value of fixed income securities will fall if the issuer is unable to repay its debt or has its credit rating reduced. Generally, the higher the perceived credit risk of the issuer, the higher the rate of interest. Bond markets may be subject to reduced liquidity. The Fund may invest in derivatives. The use of derivatives may create leverage or gearing. A relatively small movement in the value of a derivative’s underlying investment may have a larger impact, positive or negative, on the value of a fund than if the underlying investment was held instead.
DISCLAIMER
This is a marketing communication. Before making an investment, you should read the relevant Prospectus and the Key Investor Information Document (KIID), which provide full product details including investment charges and risks. These documents can be obtained, free of charge, from www.liontrust.co.uk or direct from Liontrust. Always research your own investments. If you are not a professional investor please consult a regulated financial adviser regarding the suitability of such an investment for you and your personal circumstances.
This should not be construed as advice for investment in any product or security mentioned, an offer to buy or sell units/shares of Funds mentioned, or a solicitation to purchase securities in any company or investment product. Examples of stocks are provided for general information only to demonstrate our investment philosophy. The investment being promoted is for units in a fund, not directly in the underlying assets. It contains information and analysis that is believed to be accurate at the time of publication, but is subject to change without notice. Whilst care has been taken in compiling the content of this document, no representation or warranty, express or implied, is made by Liontrust as to its accuracy or completeness, including for external sources (which may have been used) which have not been verified. It should not be copied, forwarded, reproduced, divulged or otherwise distributed in any form whether by way of fax, email, oral or otherwise, in whole or in part without the express and prior written consent of Liontrust.