Past performance is not a guide to future performance. The value of an investment and the income generated from it can fall as well as rise and is not guaranteed. You may get back less than you originally invested.
The Liontrust Strategic Bond Fund returned -1.7%* in sterling terms in February. The average return from the IA Sterling Strategic Bond sector, the Fund’s comparator benchmark, was -1.5%.
In January and the first two days of February, markets had become too sanguine about the inflationary outlook, attempting yet again to price in a “dovish pivot” by central banks. Strong US employment data caused the prevailing market narrative to be turned on its head. Throughout the month, other economic data such as inflationary data and PMI surveys also surprised to the upside. Thus, February saw the unwinding of the rally in sovereign bond yields that had occurred in January.

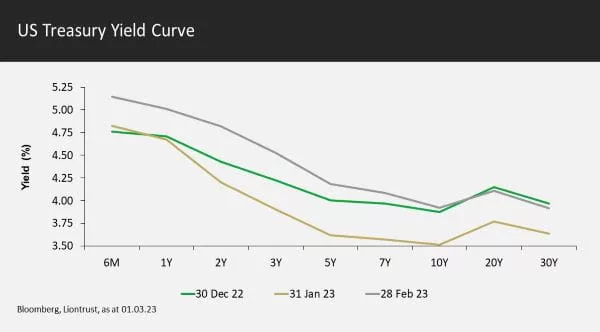
The activity in US government bonds can be seen in the shifts of the yield curve, with yields falling significantly from the end of 2022 through to the end of January, before shifting upwards significantly by the end of February. Year-to-date we have seen a bear flattening of the yield curve, with shorter-dated bonds seeing yield rises as the market moved to reprice expectations of terminal rates in this cycle.
Terminal (peak) rate forecasts for this cycle have been revised upwards both by economists and the bond markets. By the end of February, the bond market was expecting a peak in US rates in the 5.25% – 5.50% band during the third quarter, a deposit rate of either 3.75% or 4.0% in the eurozone by the end of the year, and UK rates reaching 4.75% in the autumn.
Examining the reaction function of the US Federal Reserve, there have been some suggestions that it might increase the pace of tightening back to 50 basis point increments, from its more recent 25bps hikes. However, I think the Federal Open Market Committee’s (FOMC) minutes point strongly towards 25bps being the norm for the foreseeable future. Specifically: “…almost all participants agreed that it was appropriate to raise the target range for the federal funds rate 25 basis points at this meeting,” but only “…a few participants stated that they favored raising the target range for the federal funds rate 50 basis points at this meeting or that they could have supported raising the target by that amount”. I expect the hawks on the FOMC to be placated somewhat by an increase in the dot plots with terminal rates likely to at least reach the 5.25% – 5.50% band that the market has already priced for. The ECB has stated that the next hike at its March meeting will be by 50bps and it would take a significant change in the data to stop them doing the same again in May.
“Dovish pivot” was one of the most over-used phrases in the markets’ lexicon in 2022, I’d expect it to be matched in 2023 by the profligate use of “long and variable lags”, referring to the delayed impact on economies of the cumulative tightening in monetary policy. Our strategic view remains that central banks will engineer recessions that this will increase unemployment and feed through to lower wage growth; in turn this will lead to lower core services inflation. One of our key themes for the first half of 2023 is that core services ex-shelter CPI will remain sticky; a weaker labour market is targeted by the Fed, inter alia, to make this last inflationary shoe drop. We continue to think that the impact of the cumulative tightening in monetary policy will start to really hit the economy in the second half of the year and by the end of 2023 the Fed will be in a position to be able to cut rates. Whether it chooses to cut rates is a different matter, and a delay would only lead to more cuts being needed in 2024.
With terminal rates priced into the market now reflecting a much more hawkish outcome, we believe now is a good time to add to duration. There is a risk yields go higher still, so we retain plenty of risk budget to add to duration if they do.
Furthermore, credit had rallied and was no longer unambiguously cheap, so we thought it prudent to reduce risk. We have reduced the high yield weighting from around 25% to 20%, mainly by buying protection (selling risk) on iTraxx Xover. There is still enough value in credit to not warrant going underweight, so we don’t want to bet against our strategic position of finding the asset class attractive. But, on the balance of probabilities, we think we will get a better chance to buy in the months ahead. We continue to believe that 2023 will be a year where you get paid for being active as market sentiment and asset valuations oscillate between the prospects of soft and hard landings.
Rates
In the early days of February, we tactically reduced core duration from 5 years† down to 4.5 years, believing that bond markets were pricing in a too sanguine view post the various rate rises by central banks that week. A combination of strong employment data and inflation exceeding expectations led to a rapid reversal in fortunes for sovereign bonds. We started to re-establish a strategic long duration, initially adding 0.5 years in the middle of the month. As February drew to a close, sovereign bond yields continued their rise, so we added a further 0.75 years, leaving the Fund with 5.75 years of core duration exposure. This is split between 2.25 years in the US, 0.5 years in New Zealand, and 1.5 years each in the eurozone and UK. The Fund also has a 0.5-year short in Japan, but given the nature of the Japanese Government Bond (JGB) market it is better to think of this as a special standalone alpha position rather than knocking half a year off the effective duration contribution. JGB’s have a low beta and little correlation, most of the time, to other bond markets.
Allocation
The exuberance in rates markets in January and early February also fed through to a tightening in credit spreads. Having trimmed the Fund’s investment grade weighting in January, we then reduced high yield exposure by around 5% in early February. The majority of the reduction in the allocation came via the implementation of a CDS index overlay, specifically buying protection on the iTraxx Xover CDS index, a proxy for the European high yield market.
Investment grade exposure is 50%, and net high yield exposure is 20%. Both are now at the weightings that we deem to be neutral. There is good long-term value in credit, but with the recessionary risk for the second half of 2023 rising, there will inevitably be further volatility in credit markets. If credit spreads widen enough to make valuation levels become more compelling again, then we will increase allocations to take exposure back to being overweight.
Selection
Within investment grade, we trimmed exposure to Pershing Square; the credit itself is very solid, but the bonds have not been as liquid as we desired so we have prudently reduced the holding size. On the buying side of the ledger, a small position was established in Julius Baer’s subordinated bonds, which offered an attractive yield of 6.625% in euros for a very defensive institution.
Due to using a CDS index overlay to reduce exposure, the high yield stock level turnover was low. The weighting in Tigo was lowered as a private equity pariah circles the company; any takeover would not necessarily lead to a large re-leveraging of the balance sheet but we want the flexibility to be able to add to the bonds should the market over-react. On the relative value front ,we switched some US dollar denominated subordinated Barclays debt into a more attractively priced Sterling denominated new issue.
Discrete 12 month performance to last quarter end (%)**:
Past Performance does not predict future returns

*Source: Financial Express, as at 28.02.2023, accumulation B share class, total return (net of fees and income reinvested.
**Source: Financial Express, as at 31.12.2022, accumulation B share class, total return (net of fees and income reinvested. Discrete data is not available for five full 12-month periods due to the launch date of the portfolio (08.02.18).
Fund positioning data sources: UBS Delta, Liontrust.
†Adjusted underlying duration is based on the correlation of the instruments as opposed to just the mathematical weighted average of cash flows. High yield companies’ bonds exhibit less duration sensitivity as the credit risk has a bigger proportion of the total yield; the lower the credit quality the less rate-sensitive the bond. Additionally, some subordinated financials also have low duration correlations and the bonds trade on a cash price rather than spread.
Understand common financial words and terms SEE OUR GLOSSARY
KEY RISKS
Past performance is not a guide to future performance. The value of an investment and the income generated from it can fall as well as rise and is not guaranteed. You may get back less than you originally invested.
The issue of units/shares in Liontrust Funds may be subject to an initial charge, which will have an impact on the realisable value of the investment, particularly in the short term. Investments should always be considered as long term.
Investment in the Strategic Bond Fund involves foreign currencies and may be subject to fluctuations in value due to movements in exchange rates. The value of fixed income securities will fall if the issuer is unable to repay its debt or has its credit rating reduced. Generally, the higher the perceived credit risk of the issuer, the higher the rate of interest. Bond markets may be subject to reduced liquidity. The Fund may invest in derivatives. The use of derivatives may create leverage or gearing. A relatively small movement in the value of a derivative’s underlying investment may have a larger impact, positive or negative, on the value of a fund than if the underlying investment was held instead.
DISCLAIMER
This is a marketing communication. Before making an investment, you should read the relevant Prospectus and the Key Investor Information Document (KIID), which provide full product details including investment charges and risks. These documents can be obtained, free of charge, from www.liontrust.co.uk or direct from Liontrust. Always research your own investments. If you are not a professional investor please consult a regulated financial adviser regarding the suitability of such an investment for you and your personal circumstances.
This should not be construed as advice for investment in any product or security mentioned, an offer to buy or sell units/shares of Funds mentioned, or a solicitation to purchase securities in any company or investment product. Examples of stocks are provided for general information only to demonstrate our investment philosophy. The investment being promoted is for units in a fund, not directly in the underlying assets. It contains information and analysis that is believed to be accurate at the time of publication, but is subject to change without notice. Whilst care has been taken in compiling the content of this document, no representation or warranty, express or implied, is made by Liontrust as to its accuracy or completeness, including for external sources (which may have been used) which have not been verified. It should not be copied, forwarded, reproduced, divulged or otherwise distributed in any form whether by way of fax, email, oral or otherwise, in whole or in part without the express and prior written consent of Liontrust.

