

Summary
Our analysis shows that the balanced portfolio has a significantly higher probability of beating a market timing strategy over the long term, even if the investment manager is highly skilled. Although it has been a challenging 2022 for the balanced portfolio, the historical relationship between equities and bonds will re-assert themselves. Afterall, it is when both equities and bonds are reasonably valued that they provide the most diversification benefits.
The attraction of the balanced portfolio, which typically consists of 50% to 70% of stocks and the remainder in bonds, is that it can deliver investors returns that are not too “hot” or not too “cold”, and with not too much volatility. However, following the losses in both global equities and bonds in 2022, the case for a balanced portfolio and the diversification benefits from such a strategy have come under great scrutiny.
We maintain that the case for the balanced portfolio remains intact, but time horizon is key – while there have been episodes in history where both equities and bonds sold off, our analysis in this paper shows that the balanced portfolio beats a marketing timing strategy over the long term.
At the same time, the sharp corrections in both the equity and bond markets in the last 12 months, are helping to re-assert the historical relationships between the asset classes. The 10-year US bond yield has risen 163 bp at the time of writing this paper1 and the 12-month forward price-to earnings ratio for the MSCI AC World Index has declined 18%2. Historically, the correlation between bonds and equities is mostly negative (and hence provides the most diversification benefits) when valuations for both asset classes are not expensive.
The Goldilocks portfolio: Not too hot, not too cold
The origin of balanced portfolios potentially dates back to a stock-focused research project in the 1960s. The Centre for Research in Security Prices (CRSP) was founded in 1960 to build a database of all the stocks that traded on the New York Stock Exchange (NYSE), so that researchers could understand how stock prices behaved. CRSP first collated monthly stock prices of all the stocks between 1926 and 1962, including dividends, shares outstanding, capital changes and delisting information. While it was observed then that some stocks could do very well while others went bust, the average performance of all the stocks was still a mystery. The CRSP database helped answer that question.
It turned out that buying all the stocks in the US would have given investors a return of around 8% per annum. That performance has been surprisingly stable since the CRSP database was created. Analysts have extended the work done in the US and we now have 100+ years of stock data from many countries around the world. The analysis suggests that if an investor buys all the stocks, not just a single stock, in a particular country, the long-term return will average 6-8% per annum.
Spurred by this, analysts found that buying all the bonds in a particular country would also give investors predictable long run returns, and that by mixing different proportions of stocks and bonds, investors could achieve a “goldilocks” portfolio that was “just right” in meeting their risk and return profiles.
Balanced beats market timing
One common push back against balanced portfolios is a sense of “lost opportunity” since the proportions of stocks and bonds are relatively fixed regardless of how each asset class may be performing. Would it not make more sense to try to time the market i.e., switch between asset classes?
Consider a balanced portfolio that is invested 60% in global equities and 40% in global bonds3. The portfolio value of USD1 invested in Jan 1990 to Aug 2022 is shown in Fig. 1.
Fig. 1: Ending value of a USD1 investment starting from Jan 1990
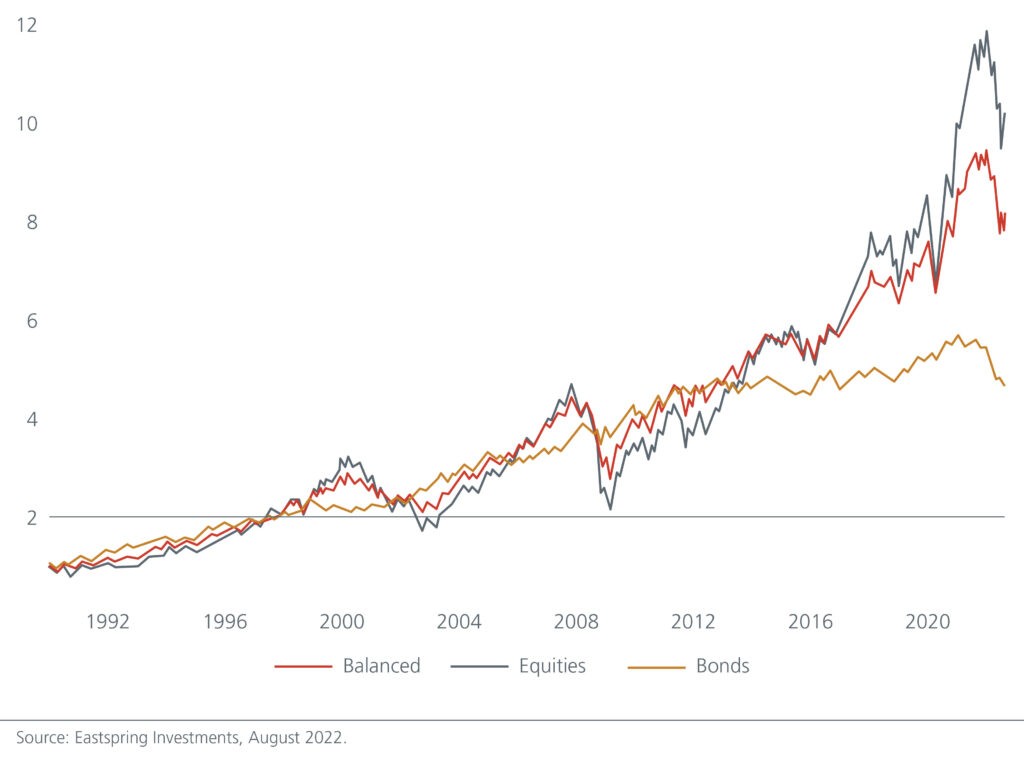
The ending value of the portfolio that is fully invested in equities is close to 10 times its initial investment in Jan 1990 while the ending value of the all-bond portfolio has gone up by about a factor of five. The ending value of the balanced 60/40 portfolio sits in between at almost 9 times its initial investment.
One reason not to always be fully invested in equities is evident from the chart and in line with the goldilocks argument – while returns are superior in the long run, the volatility may perhaps be “too hot” for some investors. This is especially so for investors with long term liabilities and the need to provide regular, stable pay-outs. The balanced portfolio therefore seems like an acceptable compromise between the high-octane equities and the too-safe bonds. However, can we do better by timing between equities and bonds?
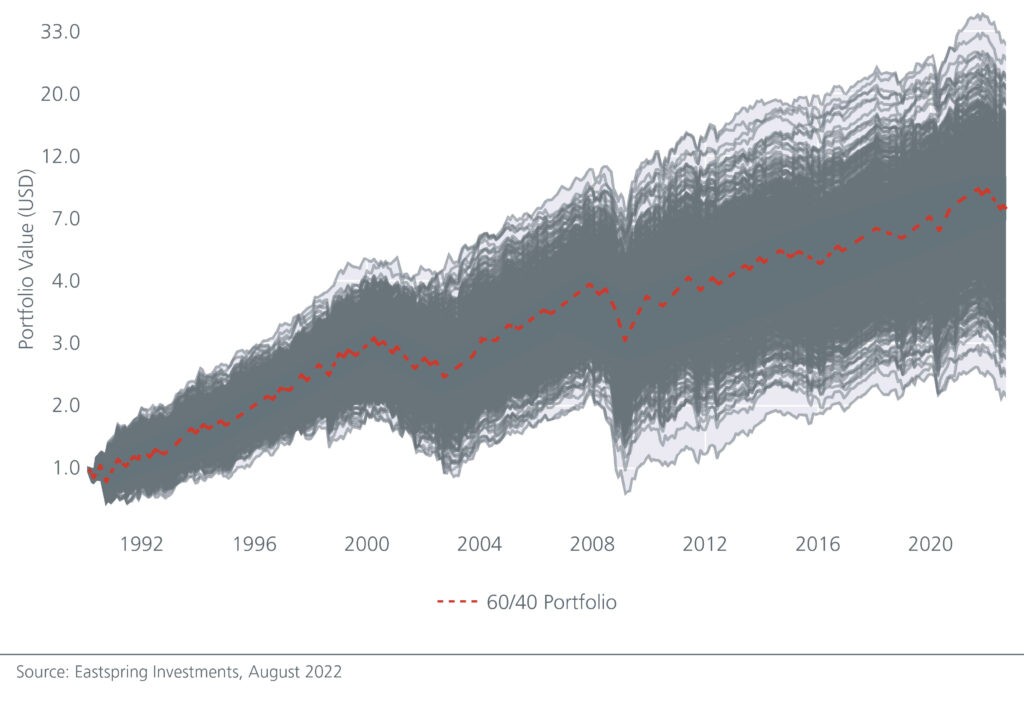
Market timing is hard, and the alternative is to stay invested in a fixed proportion throughout. To show this we calculated what would happen if an investor tried to time the market every month between 1992 and 2022; i.e., switching wholly between equities and bonds. The gray lines in Fig 2 are 1,000 possible paths that a market timing strategy could have taken over this period. The red line is the path of a 60/40 portfolio over the last 30 years. At the end of 30 years, the market timing strategy would have ended up below the 60/40 portfolio in 58% of the cases. The 58% is based on a very generous assumption that market timing does not incur any transaction cost. In reality, regularly switching between stocks and bonds will run up a large brokerage bill. If we impute a modest transaction cost of 0.1% of the value of each trade, then the 60/40 portfolio would have beaten the market timing strategy 90% of the time over the course of 30 years.
Fig 2. The paths of a market timing strategy versus a 60/40 portfolio
Long live the balanced portfolio
We have shown that over the long term, the balanced portfolio is likely to outperform a market timing strategy which tries to switch between equities and bonds. This is true even without considering transaction costs. As the historical bond and equity relationships are being re-asserted following the market corrections this year, the stage is set for the balanced portfolio to deliver the long term returns that investors desire, with the volatility that they are comfortable with. It is too premature to call for its demise.
Fornotes:
Sources:
1 Refinitiv Datastream as of 31 August 2022.
2 Refinitiv Datastream as of 31 August 2022.
3 Global equities represented by the MSCI World Index and global bonds represented by the Bloomberg Global Aggregate Index
Disclaimer:
This document is produced by Eastspring Investments (Singapore) Limited and issued in:
Singapore and Australia (for wholesale clients only) by Eastspring Investments (Singapore) Limited (UEN: 199407631H), which is incorporated in Singapore, is exempt from the requirement to hold an Australian financial services licence and is licensed and regulated by the Monetary Authority of Singapore under Singapore laws which differ from Australian laws.
Hong Kong by Eastspring Investments (Hong Kong) Limited and has not been reviewed by the Securities and Futures Commission of Hong Kong.
Indonesia by PT Eastspring Investments Indonesia, an investment manager that is licensed, registered and supervised by the Indonesia Financial Services Authority (OJK).
Malaysia by Eastspring Investments Berhad (531241-U).
This document is produced by Eastspring Investments (Singapore) Limited and issued in Thailand by TMB Asset Management Co., Ltd. Investment contains certain risks; investors are advised to carefully study the related information before investing. The past performance of any the fund is not indicative of future performance.
United States of America (for institutional clients only) by Eastspring Investments (Singapore) Limited (UEN: 199407631H), which is incorporated in Singapore and is registered with the U.S Securities and Exchange Commission as a registered investment adviser.
European Economic Area (for professional clients only) and Switzerland (for qualified investors only) by Eastspring Investments (Luxembourg) S.A., 26, Boulevard Royal, 2449 Luxembourg, Grand-Duchy of Luxembourg, registered with the Registre de Commerce et des Sociétés (Luxembourg), Register No B 173737.
United Kingdom (for professional clients only) by Eastspring Investments (Luxembourg) S.A. – UK Branch, 10 Lower Thames Street, London EC3R 6AF.
Chile (for institutional clients only) by Eastspring Investments (Singapore) Limited (UEN: 199407631H), which is incorporated in Singapore and is licensed and regulated by the Monetary Authority of Singapore under Singapore laws which differ from Chilean laws.
The afore-mentioned entities are hereinafter collectively referred to as Eastspring Investments.
The views and opinions contained herein are those of the author on this page, and may not necessarily represent views expressed or reflected in other Eastspring Investments’ communications. This document is solely for information purposes and does not have any regard to the specific investment objective, financial situation and/or particular needs of any specific persons who may receive this document. This document is not intended as an offer, a solicitation of offer or a recommendation, to deal in shares of securities or any financial instruments. It may not be published, circulated, reproduced or distributed without the prior written consent of Eastspring Investments. Reliance upon information in this posting is at the sole discretion of the reader. Please consult your own professional adviser before investing.
Investment involves risk. Past performance and the predictions, projections, or forecasts on the economy, securities markets or the economic trends of the markets are not necessarily indicative of the future or likely performance of Eastspring Investments or any of the funds managed by Eastspring Investments.
Information herein is believed to be reliable at time of publication. Data from third party sources may have been used in the preparation of this material and Eastspring Investments has not independently verified, validated or audited such data. Where lawfully permitted, Eastspring Investments does not warrant its completeness or accuracy and is not responsible for error of facts or opinion nor shall be liable for damages arising out of any person’s reliance upon this information. Any opinion or estimate contained in this document may subject to change without notice.
Eastspring Investments (excluding JV companies) companies are ultimately wholly-owned/indirect subsidiaries/associate of Prudential plc of the United Kingdom. Eastspring Investments companies (including JV’s) and Prudential plc are not affiliated in any manner with Prudential Financial, Inc., a company whose principal place of business is in the United States of America or with the Prudential Assurance Company, a subsidiary of M&G plc (a company incorporated in the United Kingdom).