The equity rally which began towards the end of Q1 last year continued in earnest over the course of Q2 2021. Undeterred by the more hawkish Federal Reserve (Fed) policy outlook. That being said, we did observe an apparent pivot evident from the mid-cycle factor rotation triggered last quarter. Small-caps and value equities which were dominating performance since November 2020, began to lose some momentum. High-quality stocks that investors had abandoned despite their strong showing in 2020, were back in vogue.
In this instalment of the WisdomTree Quarterly Equity Factor Review1, we aim to shed some light on how equity factors behaved over the last three months and how this may have impacted investors’ portfolios.
- In Q2, Quality was the only factor that managed to outperform in developed markets
- Value and High Dividend, which had benefitted strongly from the cyclical recovery in Q4 2020 and Q1 2021, suffered the most.
- In Emerging Markets, Momentum and Small Cap continues to do well. Quality posted a slight outperformance as well.
Looking forward to Q3, the value-driven recovery may continue on the back of vaccine-driven reopenings and increasing fiscal stimulus from the US. However, many indicators are pointing towards a mid-cycle rotation, and, as exemplified by recent lockdowns in Western Europe, the global health situation is still pretty fragile. Investors could benefit from diversifying their exposures and position for scenarios when more defensive or more-rounded factors could do well.
Performance in focus: Quality, the only factor that outperformed in Developed Markets
In the second quarter of 2021, the market continued to rally, benefitting from economic optimism and continued fiscal stimulus. The Morgan Stanley Capital International (MSCI) World gained 7.7% over the period (up 92.2% since March 2020’s nadir), with the US leading the way at 8.4% and Europe closely behind up 6.5%.
For factors, Q2 2021 was very different from the previous two quarters with a significant factor rotation:
- Quality was the only factor to outperform in developed markets. It beat MSCI World by 3% and MSCI Europe by almost 4%.
- Value and High Dividend posted the largest underperformances with -5.1% and -3.6% loss versus the MSCI World, respectively.
- Small Caps followed closely behind with underperformance of around -2% depending on regions
- In Emerging Markets, Momentum posted a very impressive 9.1% outperformance for the quarter. Size continued its run in the region. Quality, while less dominant, still outperformed the market.
Figure 1: Equity factor outperformance in Q2 2021 across regions

Source: WisdomTree, Bloomberg. 30th March 2021 to 30th June 2021
Historical performance is not an indication of future performance and any investments may go down in value.
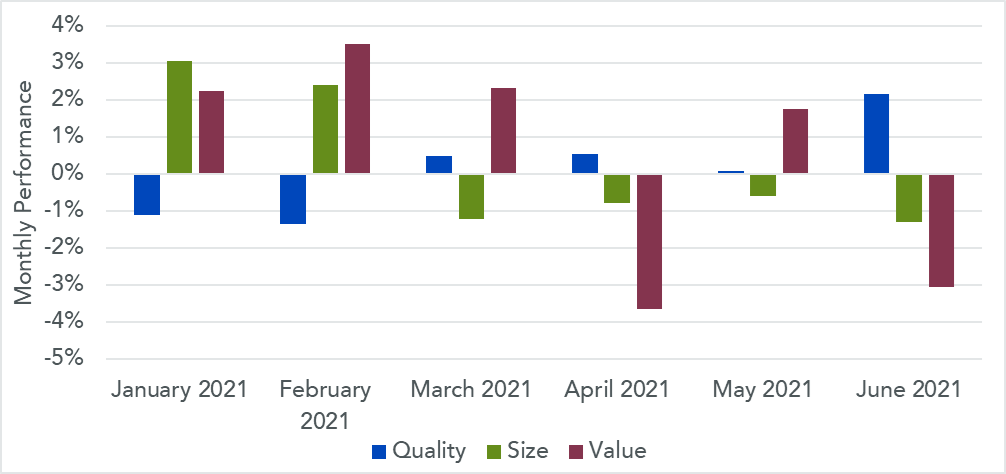
Looking at factors performance month after month, in Figure 2, the factor rotation is pretty apparent. Value and Size are showing signs of exhaustion while Quality is picking up steam. In June, it seems like this rotation may be accelerating, with Quality posting its best monthly outperformance of the year and small-cap posting its worst underperformance.
Figure 2: Monthly outperformance of equity factors versus the MSCI World in 2021

Source: WisdomTree, Bloomberg. 31st December 2020 to 30th June 2021
Historical performance is not an indication of future performance and any investments may go down in value.
Factors, Business Cycle and Rotation
Factor investing, as defined by academics, can provide two significant benefits to investors: Long term outperformance, of course, but also diversification. Each equity style tends to behave differently depending on where we are in the business cycle.
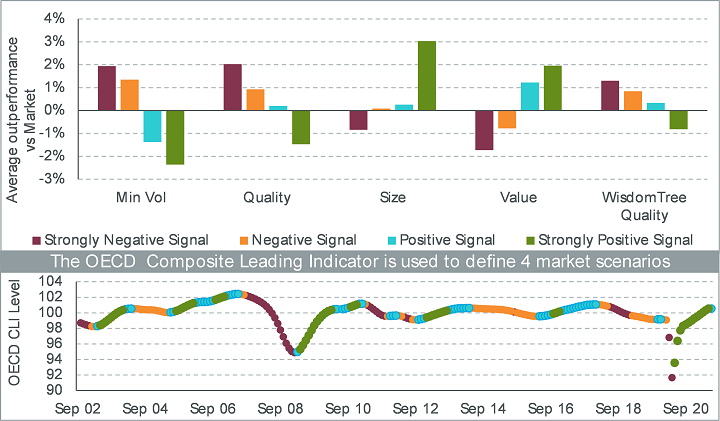
In Figure 3, we split the last 19 years into four types of periods using the Organisation for Economic Co-operation and Development (“OECD”) Composite Leading indicator (“CLI”), and we use these periods to look at the behaviours of the different equity factors.
The CLI has been designed to provide early signals of turning points in the business cycle. So, a sharp increase in CLI, for example, tends to indicate a possible economic recovery.
We observe that historically
- “green periods”, i.e. periods of large increase in CLI, have been very favourable to Size and Value. They have, however, been difficult periods for quality
- “blue periods”, i.e. periods of moderate increase in CLI, indicating slower economic growth, have been less favourable for Value and Size and significantly more favourable for Quality investments.
In other words, early cycle and recovery periods have usually favoured small caps and value stocks at the expense of quality stocks. However, when reaching mid-cycle and end-cycle periods, Quality stocks tend to take the lead. It is very notable that June 2021 marks the first time in a year or so that the CLI turns blue from green, potentially marking the arrival of the mid-cycle.
Figure 3: Average outperformance of equity factors in the quarter following the signal

Source: WisdomTree, Bloomberg. Period September 2002 to June 2021. Calculations are based on monthly returns in USD. The inception date for the WisdomTree Global Quality Dividend Growth Index is 16th October 2015.
You cannot invest directly in an index. Above numbers include backtested data. Historical performance is not an indication of future performance and any investments may go down in value.
Valuations are coming down on the back of improved earnings
In Q2 2021, valuations have decreased slightly, across majority of factors globally. Momentum, however, stands out. During the very significant rebalancing of the MSCI Momentum in May 2021, growth and quality stocks have been pushed out in favour of value stocks which led to a decrease of the Price to Earnings (P/E) Ratio of almost 15 points across geographies.
Figure 4: Historical Evolution of Price to Earnings ratios of equity factors

Source: WisdomTree, Bloomberg. As of 30th June 2021
Historical performance is not an indication of future performance and any investments may go down in Value.
Looking forward to Q3, equity markets are showing signs of pressure: S&P 500 has doubled since its low in March 2020, valuations are elevated, “Tapering” has appeared once again in the Fed dictionary, and the delta variant is increasing concerns it might derail the economic recovery. In that context, Investors could benefit from diversifying their exposures and reposition for scenarios when more defensive or more-rounded factors could do well.
Sources
1 World is proxied by MSCI World net TR Index. US is proxied by MSCI USA net TR Index. Europe is proxied by MSCI Europe net TR Index. Emerging Markets is proxied by MSCI Emerging Markets net TR Index. Minimum Volatility is proxied by the relevant MSCI Min Volatility net total return index. Quality is proxied by the relevant MSCI Quality net total return index. Momentum is proxied by the relevant MSCI Momentum net total return index. High Dividend is proxied by the relevant MSCI High Dividend net total return index. Size is proxied by the relevant MSCI Small Cap net total return index. Value is proxied by the relevant MSCI Enhanced Value net total return index.

