
China’s continued economic woes
China’s economic woes continue. After a brief spurt of optimism as pandemic restrictions faded at the turn of the year, the subsequent economic recovery has been underwhelming and now verges on non-existent.
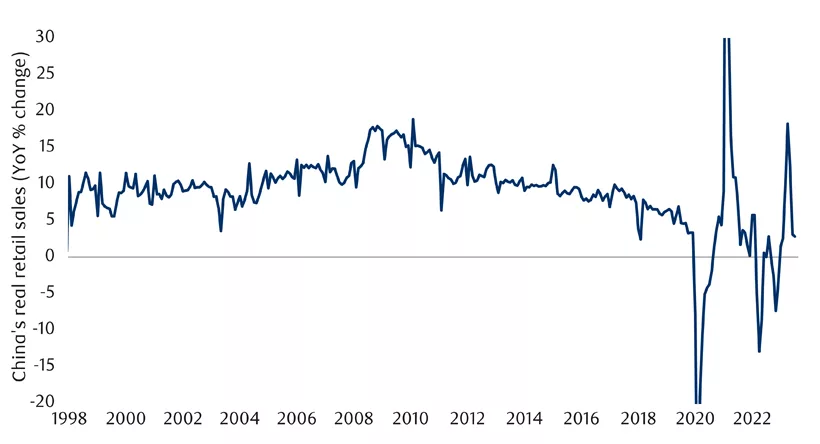
Chinese retail sales growth continues to decelerate, falling outright in July (see next chart). The annual inflation-adjusted growth rate is just +2.8% year-over-year (YoY). This is the slowest rate outside of pandemic lockdowns in decades (see subsequent chart). For a country hoping to transition toward consumer spending from a structural standpoint and targeting a 5% 2023 growth rate from a cyclical standpoint, it is an unpromising development.
China’s retail sales growth continues to slow
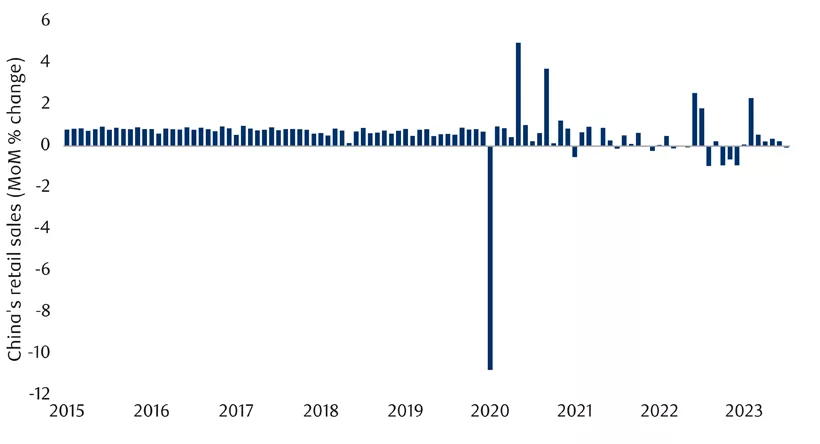
China’s retail sales have been weak
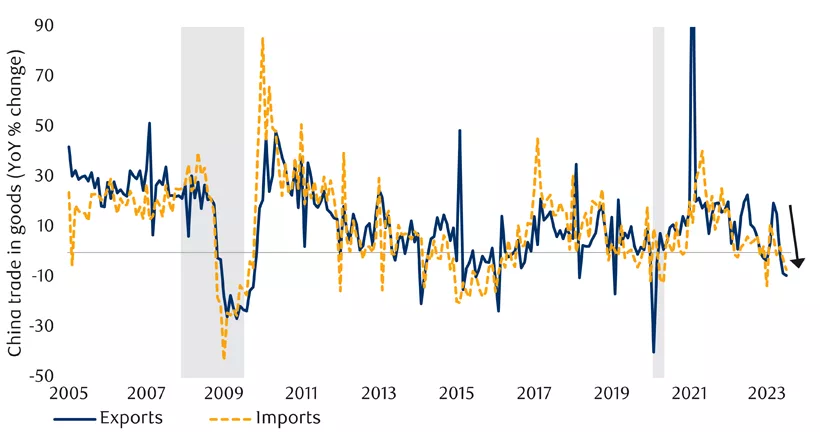
China’s international trade is also in free-fall (see next chart). In fairness, this is not a uniquely Chinese development – partially reflecting lower commodity prices, tepid global demand for goods and geopolitical tensions. But it does also say something about the state of the Chinese economy.
Chinese trade growth decelerates
Relatedly, China’s two manufacturing purchasing manager indices have now fallen below the critical 50 threshold that divides growth from decline.
While the country’s overall unemployment rate remains fine, the much-maligned youth unemployment rate continues to rise. It reached 21.3% in June. We examined possible explanations for this in the June 27 #MacroMemo. In response, many Chinese youth are effectively dropping out of the rat race. They are talking about “lying flat” (rejecting societal pressures to work hard) and rejecting President Xi’s advice to “eat bitterness” (persevere through hardship).
In addition to the negative economic implications and the surprising fact that a country with a contracting number of young people is nevertheless struggling to employ them, it is not good from a political standpoint. Past political uprisings in China have been led by students, and so this could represent a threat to the ruling Community Party.
Incredibly, the Chinese government has just announced it will cease publishing the country’s youth unemployment rate – hardly the solution to the problem.
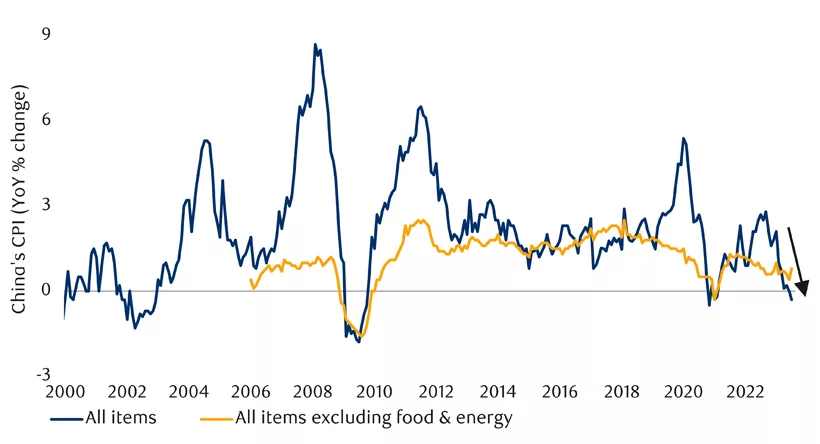
China’s Consumer Price Index (CPI) also just tipped into slight deflation in July. The headline CPI print joined the Producer Price Index (PPI) in reporting an outright decline over the past 12 months (see next chart).
To be clear, it is far from certain that this deflation will continue or that anything especially pernicious must follow. However, the development is viewed quite differently in China than it might be elsewhere. Whereas many countries would welcome a brief spell of deflation to help unwind the excessive price increases of the past two years, China never experienced the same excessive inflation. As a result, this deflation should instead be viewed through the lens of more traditional economic analysis: falling prices can create a vicious circle in which economic actors rationally respond to the expectation that prices will be lower in the future by deferring spending, weakening the economy and, in turn, causing prices to fall further.
Again, we are not budgeting for this, but China’s deflation could become an economic problem.
China’s headline inflation fell into negative territory
China’s housing problems
Policies introduced a few years ago to slow China’s housing boom were entirely logical and even desirous from the perspective of long-term growth. The housing boom had become a bubble, resulting in unaffordable housing, the misallocation of capital — including a heavy inclination among Chinese households toward plunking most of their savings into real estate –, excessive construction and over-leveraged builders, all the while concealing structural fiscal deficits at the local government level.
But the consequences of the well-intentioned policy brake are proving hard for China’s economy to handle in the short run. Real estate and construction spending were disproportionate drivers of the country’s torrid growth rate over the past several decades. With that gone, the economy is sputtering. Problematic debt excesses are becoming apparent. It even extends to consumer spending: Chinese households are disinclined to spend because their primary investment is no longer appreciating, and what is more, many are concerned about the apartments they have paid for but that have stopped being built by wobbling builders.
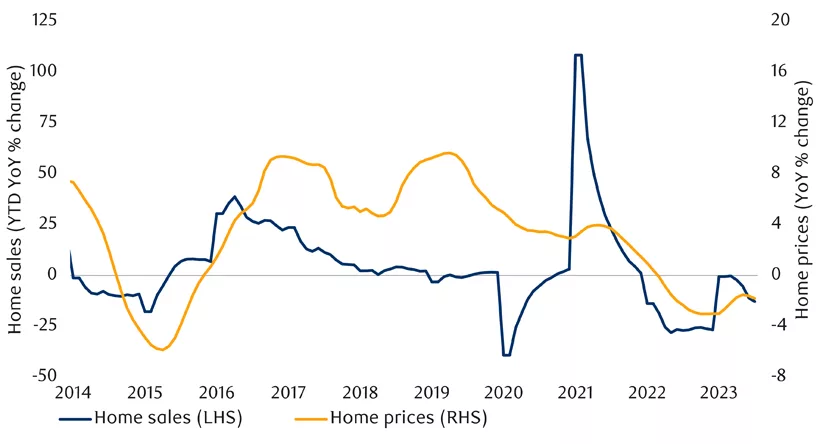
China’s housing market continues to actively weaken: China Real Estate Information Corp. reported that the 100 largest developers in the country sold a third less private housing by value in July relative to June, and that this was the lowest monthly tally in three years. Home prices were already falling, but have begun to fall more quickly again. Home sales have similarly swooned again (see next chart).
China housing continues its downward spiral
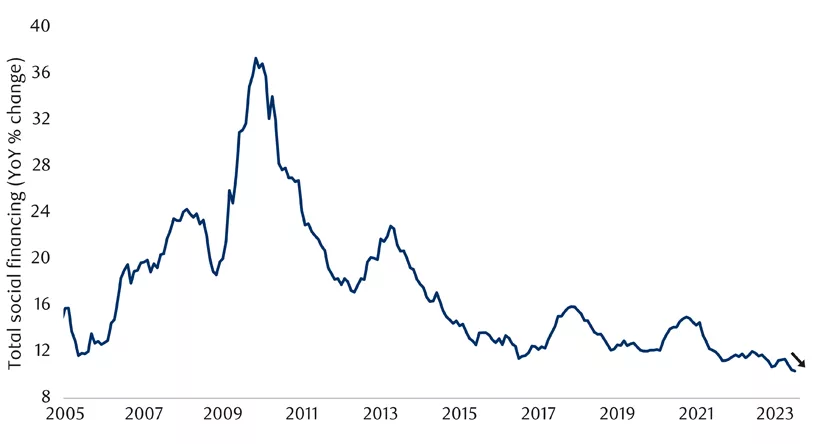
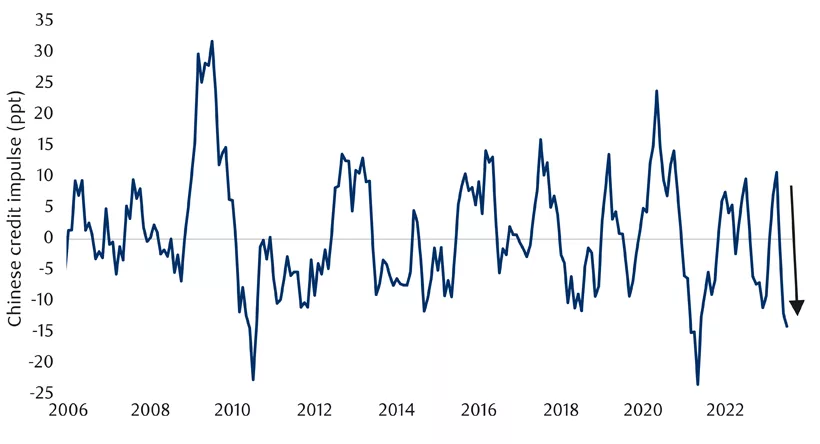
Reflecting housing weakness and a tighter credit environment more broadly, Chinese private credit growth continues to decelerate on a year-over-year basis, reaching its weakest rate in decades (see next chart). The Chinese credit impulse also shows that the rate of decline is getting notably worse (see subsequent chart).
China’s private credit growth has decelerated again
China’s credit impulse plunges after a brief reopening bounce
Builders in China are again capturing negative headlines. At its essence, these companies borrowed too much in a race to expand, and are in perilous condition now that the housing boom has ended. Evergrande is back in the headlines, formally seeking U.S. court approval to declare bankruptcy.
Meanwhile, fellow behemoth Country Garden now appears to be following a similar downward spiral. The company recently failed to pay interest on its debt. Its stock price is now down to just 9 cents per share, suggesting insolvency is expected. Country Garden says it expects to lose US$7.6 billion over the first six months of this year alone. While Country Garden mercifully has about 40% fewer liabilities than Evergrande (still amounting to US$199 billion), it somehow has nearly four times more housing projects currently underway in China. It has committed to constructing 700,000 units in 2023 (for Canadian readers, that is about three times more than all of the units built in Canada in a year), though it is struggling to meet that target.
This is not just a problem for shareholders and bondholders, but also for new homebuyers in China. They pay an unusually large fraction of a property’s value upfront before construction commences, and so are highly interested parties in whether these builders survive.
China stimulus
So what are China’s policymakers doing about all of this? Less than you might suppose, given that the combination of deflation and weak growth both call for additional policy support, in contrast to the conflicting signals many countries must navigate.
Nevertheless, Chinese policymakers are arguably doing more than is commonly imagined. But instead of one big-bang action, they are taking many smaller actions, as is often the case in China, the actions are skewed toward rule changes and away from grand stimulus cheques.
Rate cuts
On August 15, China delivered its second rate cut in three months, though once again the magnitude of the move was just 15 basis points. That’s less than the 25-basis-point minimum used by most central banks around the world. The People’s Bank of China also failed to fully pass the rate cut along, with some normally associated prime rates remaining unchanged.
Addressing currency weakness
What is constraining the central bank? The weak yuan figures centrally. China’s exchange rate to the U.S. has already fallen from 6.3 to the dollar in early 2023 to 7.2 today. That’s a 12% depreciation in a fairly short time frame – a vote of non-confidence by international markets. It’s also an undesirable level of volatility for a country so reliant on international trade, and an insult to a country that views its currency as a barometer for its international standing. If the central bank were to cut rates by more, the currency would presumably weaken even further given that most other central banks are still thinking about rate hikes.
Of course, while the weaker currency is embarrassing, it isn’t entirely malevolent. In fact, the depreciation should help to revive inflation by increasing the cost of imports. It may also help to pull exports out of a tailspin via improved competitiveness. As such, the currency can do some of the heavy lifting that further monetary stimulus would normally target.
But there is a limit to how far a currency can depreciate before it creates significant concerns about a country. China’s leadership apparently views a 7.35 USDCNY exchange rate as the limit of its tolerance, which is not far from the current levels. The government has told state-owned banks to increase their interventions, and the central banks indicated it will endeavour to prevent further large moves. Given the size of China’s currency reserves, it seems wise to expect the depreciation to slow from here, or even grind to a halt.
Solutions for local government debt
We have written extensively about China’s local government debt problem. The national government is now endeavouring to do something about it.
A report on August 11 stated that many provincial-level governments will be given permission to issue up to one trillion renminbi in bonds (around US$150 billion) to repay problematic off-balance sheet liabilities. This is not nearly enough to deal with the entire scope of the issue and will unavoidably increase the debt burden of Chinese provinces. But it will presumably address the most urgent problem cases. Additional funding and/or refinancing channels are also expected, possibly including debt restructuring.
Housing stimulus
Despite concerns about re-inflating a housing bubble, Chinese policymakers are now scrambling to revive the housing market for the sake of better economic growth. Commercial banks were recently told to lower their mortgage rates for outstanding borrowers, and to reduce the required down-payment ratio for new buyers. Both of these are significant steps.
Further actions are expected based on the central bank’s promise to “timely adjust and optimize real estate policies.” The government has also abandoned prior proclamations that housing is for living in rather than for speculation.
Corporate stimulus
The government recently announced tax relief measures for small businesses that will be maintained through the end of 2027.
China’s National Development and Reform Commission, the country’s top economic planning agency, released a broad set of policies designed to support the corporate sector. This sector had previously been neglected and even actively undermined by a prior policy pivot two years ago. They include:
- Forming a “stable, fair, transparent and predictable” private business environment by eliminating market-entry barriers, ensuring that competition is fair and augmenting access to credit.
- Strengthening the rule of law and intellectual property rights.
- Enhancing corporate governance and innovative capacity, and encouraging current and future entrepreneurs.
Of relevance to publicly traded companies, the China Security Regulatory Commission is taking a number of measures:
- Extending trading hours.
- Cutting the cost of transacting on Chinese stock exchanges by 30%.
- Supporting share buybacks and unshackling market makers.
Hukou reform
In contrast to most countries, Chinese people do not really have national citizenship so much as local citizenship. People cannot move from one region to another without giving up their right to public education and health care. They often cannot buy real estate in the new region. Most acutely, approximately 292 million rural migrants work in China’s cities but are unable to properly integrate into urban life.
The economy would obviously operate much more smoothly if these restrictions were gone. Hukou reform, as it is called, has long been a talking point, and there have been incremental steps taken in the past.
In early August, China announced plans to lower the bar for obtaining an urban hukou. The plan would eliminate restrictions altogether for cities of fewer than 3 million people, and relax them for cities of 3-5 million people. Bigger cities will also be encouraged to ease some restrictions.
This is not the first time there have been such rumblings. A version of the plan was first announced in 2019. But the Ministry of Public Security indicated that this new plan will be implemented by the end of August. A complication is that hukou policies have been decentralized and are now set individually by municipalities. It will thus take time to fully overhaul.
Other policies
Other supportive economic policies include:
- Supporting the auto market by tweaking carpurchase restrictions. There is a limit on the number of cars that can operate in many regions.
- Investing in electric vehicle infrastructure.
- Encouraging restaurants to lengthen their hours and reduce ticket fees for tourist sites.
- Encouraging rural regions to subsidize big-ticket purchases such as home appliances and home renovation materials.
- Supporting consumer-goods manufacturers to increase their production capacity.
Stimulus bottom line
The bottom line is that when you tally up this Chinese stimulus, it is actually pretty significant:
- There are structural changes that could unleash longer-term growth via hukou reform.
- Some key housing levers have been pulled to encourage more demand.
- The modest rate cuts combined with a weaker currency are not trivial.
- Local government debt problems are being tackled seriously, if arguably incompletely.
- Business policies are being eased after a period of cracking down on entrepreneurs.
Certainly, more policy support would be welcome, and more is likely. China still has a fighting chance of hitting 5% growth this year, despite recent woes.
Higher yields
Bond yields have continued to rise. with the U.S. 10-year yield now up to 4.34%. This is its highest level this cycle, up from nearly a percentage point lower in the spring. While the latest Fed Minutes were somewhat hawkish, the reason for the higher yields isn’t so much that the market now expects greatly more monetary tightening. Yes, an extra 50 basis points or so of expectations were tacked on a few months ago, but market thinking on the subject has been largely static since then.
Instead, the 10-year yield is arguably higher in recent weeks for a few other reasons:
- Some recent data, including U.S. retail sales, has remained resilient – arguing it may be harder to tame inflation.
- The U.S. debt downgrade (discussed at length later in this publication) has inserted an additional risk premium into Treasury bonds.
- Treasury bond issuance has increased significantly. This is in part because of large and mounting deficits, and in part for cash management reasons as the Treasury replenishes its coffer after its reserves ran almost dry during the debt-ceiling standoff in the spring.
- As Japan has allowed its own bond yields to rise, that has pulled some capital out of the U.S.
- There have been significant net outflows of Chinese money from U.S. Treasuries in recent months, presumably at least in part as China defends its currency.
Economic trends
On the subject of stronger U.S. retail sales, July managed a credible 0.7% gain, more than had been expected. One slight caveat is that the sales of big-ticket items were weaker: vehicles, furniture and electronics. Presumably the cost of borrowing is beginning to weigh on these products.
Looking ahead, spending in September and beyond could be more subdued due to the effect of the U.S. student loan moratorium ending on September 1. This will result in additional monthly payments averaging hundreds of dollars for 43 million Americans.
The U.S. payrolls number for July – somewhat old news but arriving after the last #MacroMemo – was just +187,000. This was perfectly fine by itself, but it undershot the consensus. It also came alongside a downward revision to earlier months of -49,000 positions, and translated into a surprising 0.2% monthly decline in aggregate hours worked.
In other words, there were more workers, but the entire workforce nevertheless worked slightly fewer hours. That’s actually the fourth decline in five months.
Manufacturing employment and information employment were both down. Temporary employment also declined for a sixth month in a row – a classic leading indicator. The big exception was private education and health, which combined for 100,000 new jobs. While these jobs are entirely legitimate, they don’t have much to say about business confidence.
Canada’s July employment number was weaker, with the loss of 6,400 workers. That’s the second decline in three months, though the positive month sandwiched in the middle managed a whopping 59,900 additional jobs. We still believe developed-world labour markets are gradually rolling over.
Canada’s monthly Gross Domestic Product (GDP) print was a solid +0.3% in May, but this misses a few things. First, the goods side of the equation fell by 0.3% month-over-month (MoM), hurt in part by wildfires. Second, the preliminary June reading was -0.2%, meaning it is set to mostly undo the prior month’s gain.
Looking forward, distortions should continue to blur the economic picture over the subsequent few months. In Canada, there was a port strike in July. We also saw further terrible wildfires in August – culminating in the nearly complete evacuation of the Northwest Territory’s capital Yellowknife, extensive fires around the country’s fastest growing city of Kelowna, plus further fires on the east coast.
In the U.S., smaller distortions may arise from the devastating fire in Hawaii and an unusual tropical storm on the west coast. In all cases, GDP should be temporarily impeded and then bounce back later.
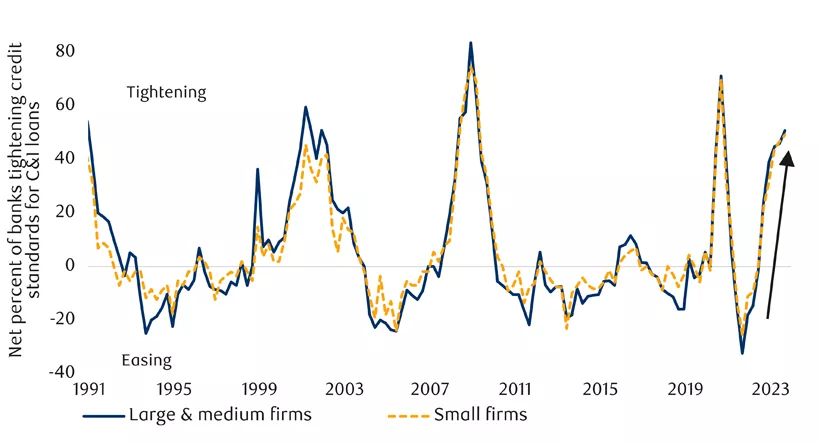
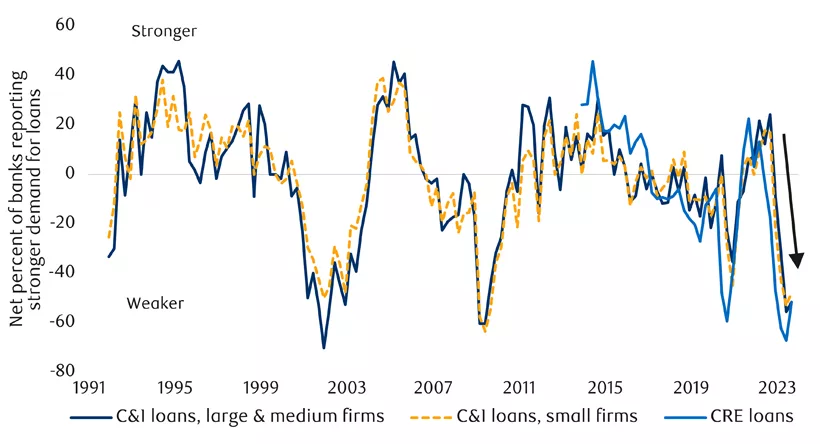
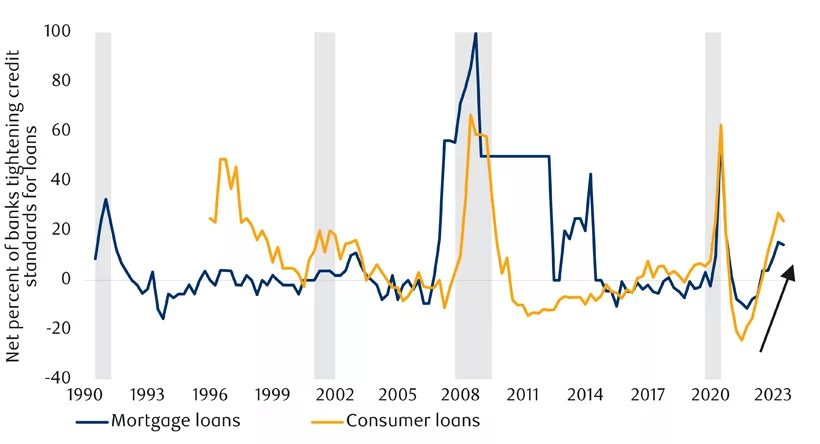
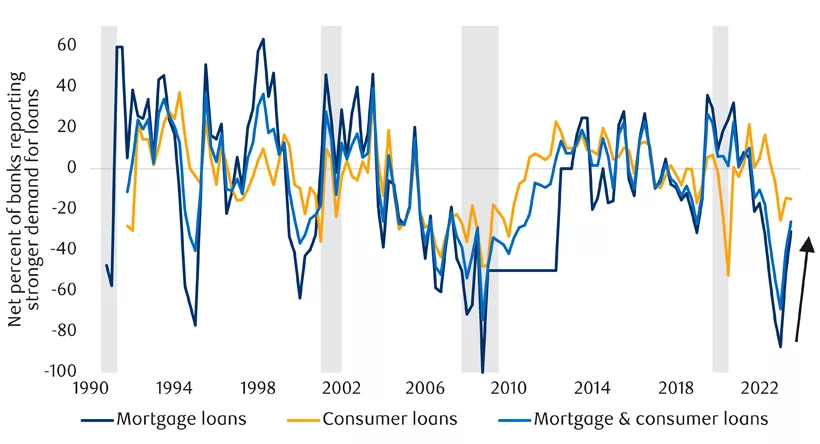
Finally, U.S. lending standards continue to tighten (see next chart). The magnitude of this is entirely consistent with past recessions. The picture is weak but less grim with regard to the demand for business credit, and the supply of and demand for consumer credit (see subsequent charts).
U.S. business lending standards are tightening
U.S. demand for business loans has plunged
U.S. bank lending standards for consumers remain tight
U.S. consumer demand for loans is rebounding
A recession leading indicator
We mentioned in the August 1 #MacroMemo that some emerging market central banks have been reliable leading indicators for developed-world monetary policy so far this cycle. They hiked rates first, and some are now beginning to reverse course.
We can extend that pattern to the economic space. The central banks that raised their policy rates first and most aggressively are now underperforming economically. A study by The Economist magazine of eight such countries finds that their economies are now underperforming the rest. The Chilean unemployment rate is now up by a full percentage point and also rising in other markets such as Brazil.
This is arguably good news because a weaker economy should lead to tamer inflation. It is also heartening from a purely technical perspective that monetary policy is not completely disconnected from the economy, as one would be tempted to conclude otherwise based on the remarkable resilience of so many economies today. Instead, this would appear to be a function of timing, with the lag from policy action to economic reaction proving surprisingly long.
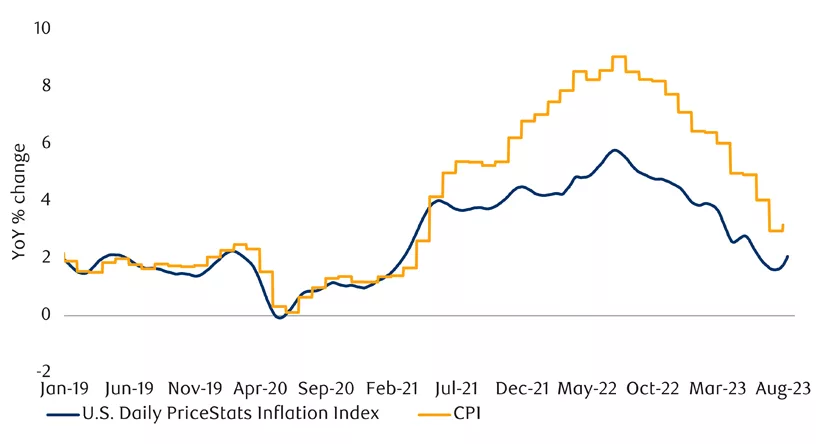
Inflation hiccup
Year-over-year inflation failed to decline in July. The U.S. Consumer Price Index (CPI) print actually rose from 3.0% to 3.2%. But this was entirely expected because the year-ago month that fell out of the annual equation was unusually weak, in sharp contrast to the extremely strong readings that had preceded it. Those higher readings had guaranteed the year-over-year (YoY) reading would be on a sharply downward trajectory over the entirety of 2023 until now. Incidentally, Canadian CPI performed similarly in July, rising from 2.9% to 3.3%.
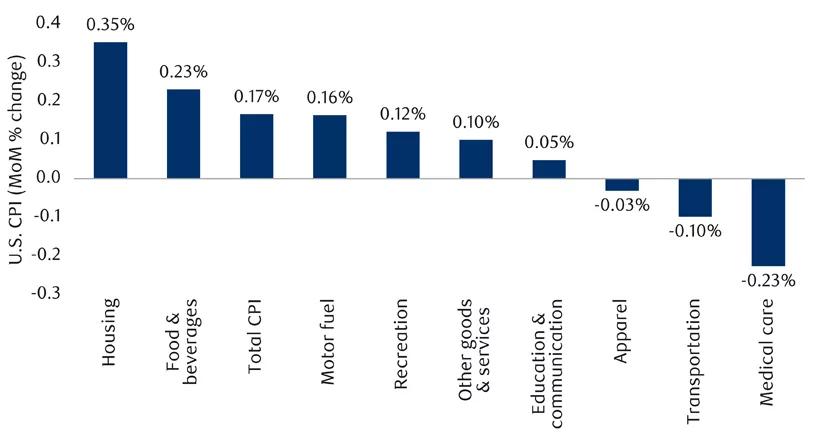
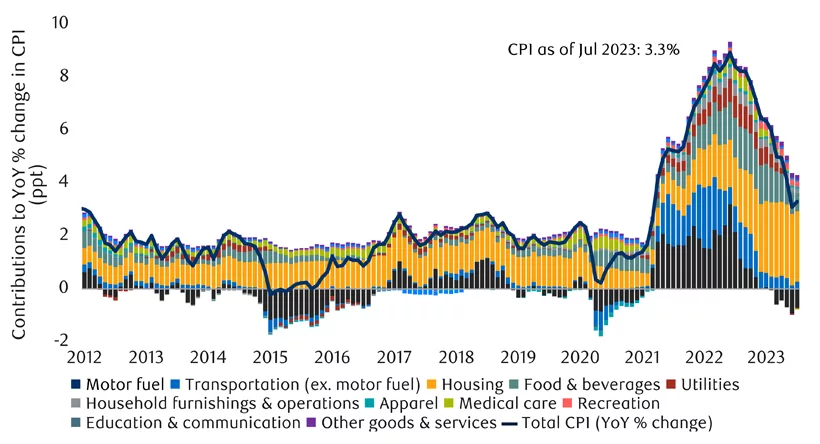
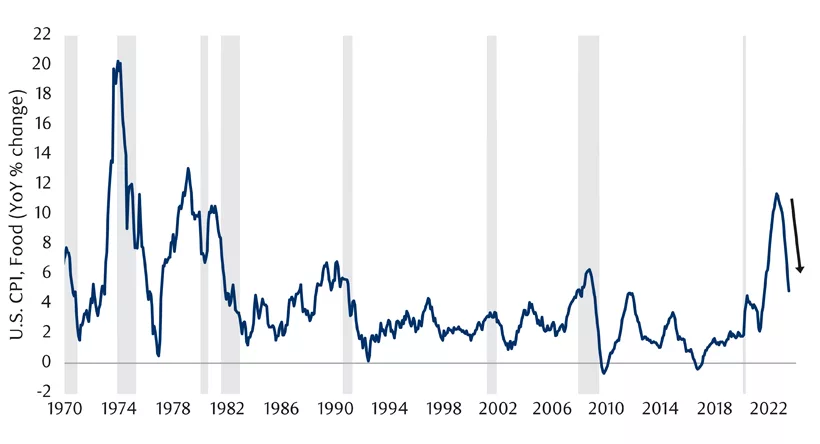
In reality, the July inflation prints were fine. U.S. core inflation still fell, from +4.8% to +4.7YoY. Headline and core CPI in the U.S. both rose by a manageable 0.2% on a month-over-month basis. No sector particularly leapt out in its intransigence, with the exception of housing inflation, which is nevertheless decelerating and famously lagged (see next two charts). Food inflation is looking a lot better (see subsequent chart).
Month-over-month change in inflation by category
Housing and food are driving U.S. inflation
U.S. food inflation has declined
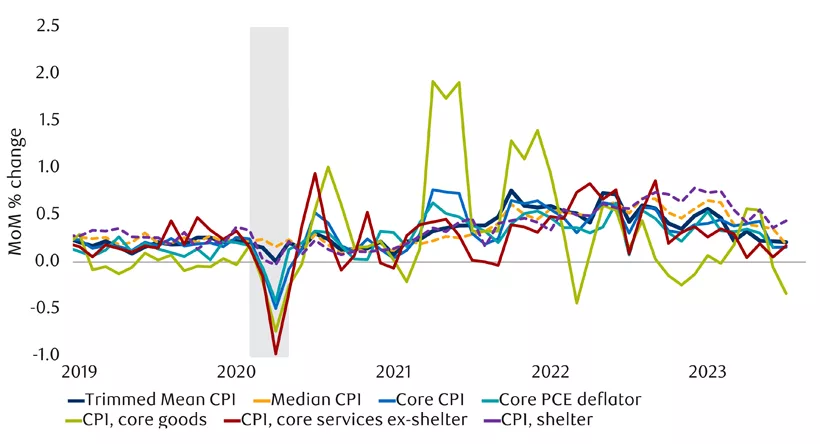
Our suite of core inflation metrics has mostly improved over the past several months (see next chart).
U.S. core inflation metrics have mostly improved
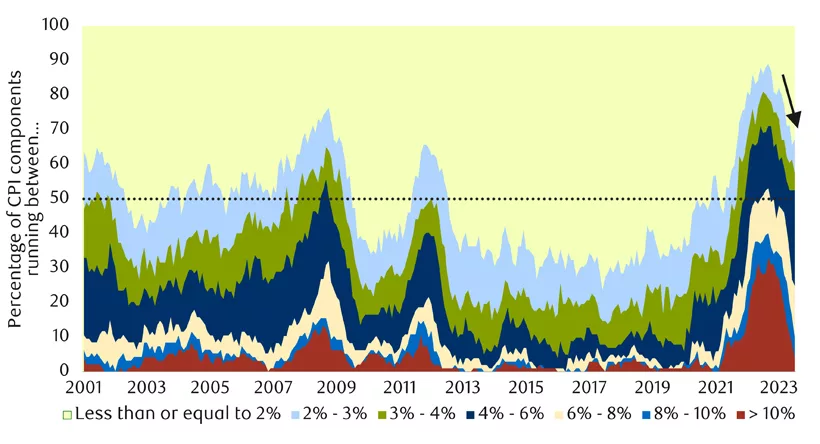
Importantly, the breadth of U.S. inflation continues to narrow meaningfully. At one point fully a third of the U.S. consumer price basket was experiencing inflation of 10% or more. That fraction is now just 4% today (see red shading in next chart).
High inflation in the U.S. is becoming much less broad
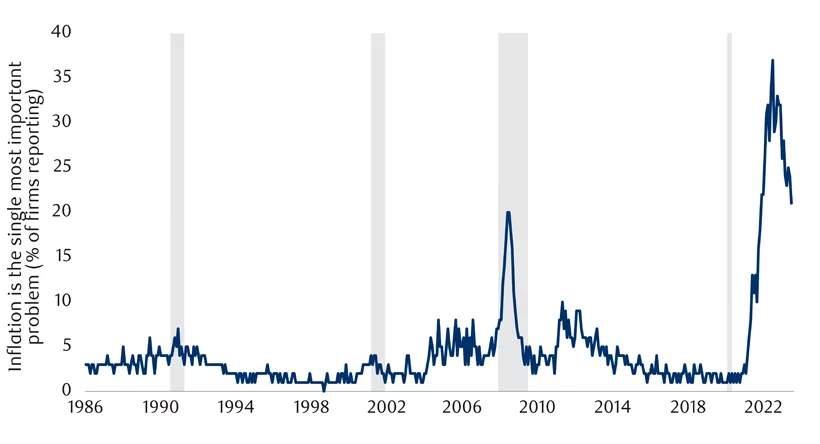
Similarly, businesses are much less concerned about inflation than they were, though they are still aggravated by it (see next chart).
Biggest small business problem: inflation
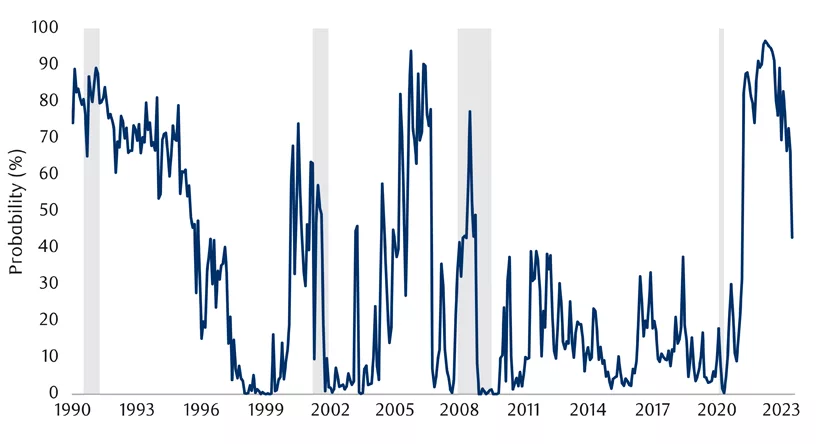
The St. Louis Fed’s Price Pressures Measure estimates the risk of inflation greater than 2.5% over the next year. This measure has lately fallen from near certainty to less than 50% (see next chart). That’s quite something.
U.S. Price Pressures Measure has fallen sharply
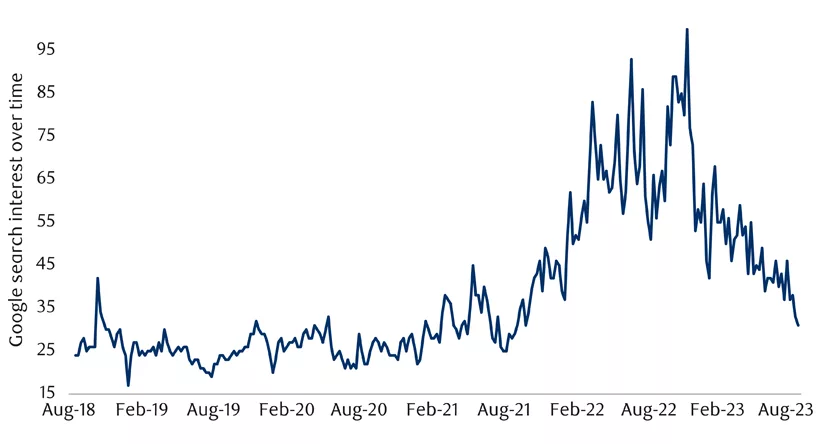
Worldwide Google searches for the word ‘inflation’ also continue to descend, at an accelerating rate recently (see next chart). It still isn’t fully back to normal, but it is most of the way there.
Worldwide Google searches on ‘inflation’ fall
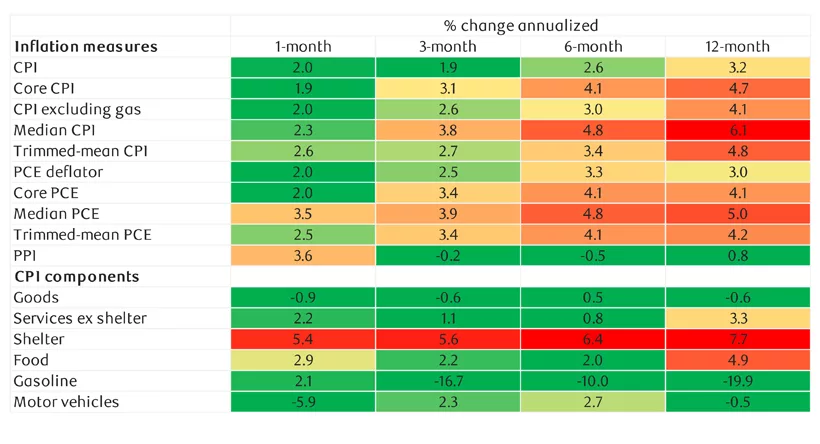
Finally, we had been arguing for the past six weeks that while the official annual inflation reading was around 3%, the true inflation reading was more like 4-6% when one looked at the annual pace of core inflation, CPI excluding the helpful effect of falling gas prices, or median CPI.
That is all true, but it slightly misses the mark. Those 4-6% annual paces are somewhat stale. The actual trend in those sticky indicators has been considerably more forgiving in recent months (see next table):
- The 3-month annualize trend for core inflation is just 3.1%.
- For CPI excluding gas it is 2.6%.
- For median CPI it is 3.8%.
So instead of “true” inflation being 2-4 percentage points higher than target, it is probably fairer to argue that “true” inflation is about 0.5-2 percentage points higher than target. There is still work to be done, and it is probably a bit more work than the headline inflation figure would suggest. However, by the same token it is less than we were first thinking.
Inflation indicators have eased
To be sure, improvement gets harder from here as the base effects cease to cooperate as nicely, given the resilience of the economy, based on reviving real-time inflation signals (see next chart), and the effect of the increase in gas prices that only nicked July inflation but will impact August inflation more forcefully.
Improvement in U.S. inflation gets harder from here
U.S. debt downgrade
Ratings agency Fitch downgraded its U.S. sovereign debt rating from a pristine AAA to a blemished AA+ in early August. Because Standard and Poor’s already downgraded the U.S. way back in 2011, that means two out of the three largest ratings agencies now believe U.S. debt has become less trustworthy, making the de facto rating just AA+. When S&P downgraded the U.S. debt rating a dozen years ago the implications were smaller because the other two main ratings agencies maintained the AAA designation at that time.
Two key questions emerge from this decision – was it warranted, and what are the implications?
Downgrade warranted
The only way to argue that the U.S. downgrade was not warranted is that the U.S. is so exceptional that the concept of a debt rating doesn’t apply. This is not entirely ridiculous:
- The U.S. is the world’s safe-haven currency.
- Its bond market is the deepest and largest in the world.
- Its large and diversified economy provides the theoretical capacity to service its debt.
- By virtue of controlling its own currency and central bank, it is highly unlikely that the U.S. would ever suffer a sustained default.
But, evaluated by the same metrics as every other country, the U.S. downgrade is entirely warranted due to a mix of political and fiscal considerations, and arguably long overdue.
From a political standpoint, the U.S. debt has been repeatedly mismanaged, most obviously in the form of several near-misses with the country’s debt ceiling that could have resulted in a technical debt default. In late May, the country came within a few days of a technical default simply because political leaders were playing chicken with one another. Sovereign credit default swaps briefly surged and investors had to make contingency plans in the event that their Treasury bills were not repaid. The prior S&P downgrade in 2011 also came on the heels of a debt ceiling near-miss.
More general evidence of deteriorating fiscal governance include a complex budgeting process that lends itself to protracted budget battles. Some of these battles have led to the outright shutdown of the government. The extreme and mounting polarization of the two major political parties is an underlying concern. Fitch staff even reportedly cited the January 6, 2021 attack on the U.S. Capitol Building in justifying their worries about the stability of the U.S. political apparatus.
It is also notable that fiscal sustainability is no longer a talking point for most American politicians. There is no medium-term fiscal plan for the U.S., and little has been done to address expected rising costs from social security and Medicare as the population ages.
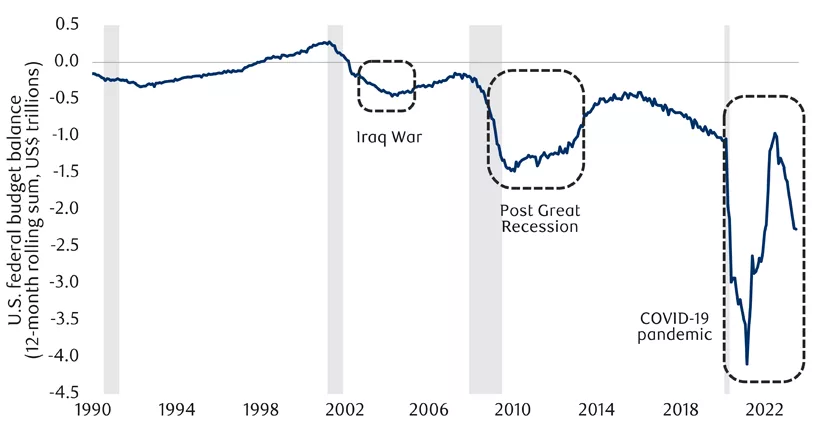
The Congressional Budget Office just increased this year’s anticipated federal deficit to $1.7 trillion. This is a huge sum representing a large 6.5% of GDP. The number is actively rising, is larger than the enormous 5.5% deficit struck last year, and is the culmination of a mix of tax cuts and spending initiatives implemented over the past decade (see next chart).
Deficit spending has seemingly expanded from its traditional role as a countercyclical tool within a Keynesian framework to also being a procyclical tool. In other words, there are large deficits during recessions, but also during boom times. U.S. fiscal commitments over the next several years prevent the trajectory from getting much better.
U.S. fiscal deficit has expanded back out
The U.S. government debt-to-GDP ratio has now reached 112.9% of GDP, nearly double the ratio maintained before the global financial crisis. The new U.S. debt load is also more than double the median of countries that retain their AAA rating.
The U.S. is on pace to spend about a tenth of its federal revenue simply servicing federal debt by 2025, hugely more than the 1% median for AAA countries and considerably above the 2.8% median of other AA-rated countries. U.S. exceptionalism is arguably why the U.S. debt rating isn’t even lower than AA+.
Downgrade implications
It wasn’t clear from a theoretical standpoint how the bond market should react to the U.S. downgrade.
Bond bulls could argue that the bad news constituted an event that should increase risk aversion, with the U.S. safe-haven status perversely increasing demand for U.S. Treasuries and thus sending yields lower for the very instrument now deemed more dangerous.
Conversely, bond bears could observe that the rating downgrade itself signified that U.S. debt has become more dangerous, necessitating a bigger risk premium and thus a higher bond yield. Furthermore, while the effect is limited, some institutional investors have mandates that disallow the holding of debt rated less than AAA, requiring a small amount of forced selling (though a small number of other investors are only allowed to own lower-rated debt and might theoretically now be eligible to purchase U.S. Treasuries for the first time). For the sake of completeness, the risk-weighting of Treasury debt on bank balance sheets does not change, nor does the eligibility of Treasury debt to be used as collateral.
A final competing interpretation was that bond yields didn’t have to move at all since the underlying political and fiscal issues were already visible for all to see, even if not reflected in the official rating until recently.
In practice, bond yields have increased, with the U.S. 10-year bond up by a significant 38 basis points since the announcement on August 1. Some small risk premium is apparently warranted. Government bond markets around the world must now stand on their own two feet as central bank bond-buying has morphed into selling. North American bond markets are also no longer the only game in town for investors seeking a positive nominal yield with fairly low risk.
In the end, U.S. yields are modestly higher, but the effect of the downgrade is mostly symbolic. In a best-case scenario, U.S. politicians will be stirred by this indignity and pursue a more cautious fiscal path ahead. But we aren’t counting on that. It is more likely to be business as usual, with substantial deficits as far as the eye can see.
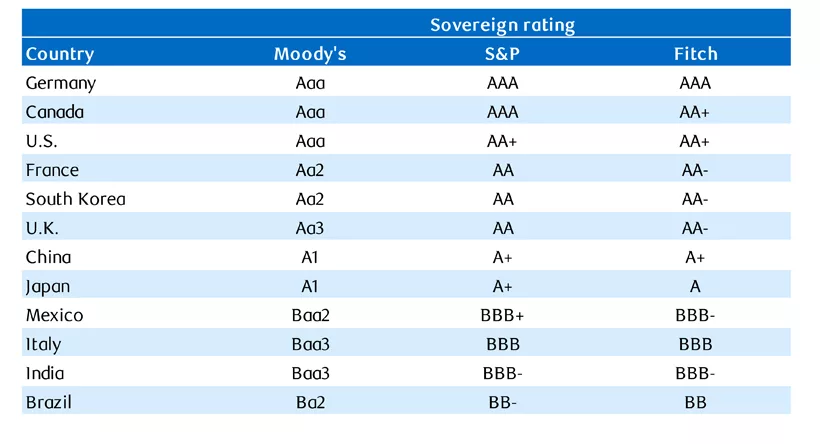
To be fair, there are plenty of countries with lower debt ratings than the U.S. that remain entirely viable from an economic and fiscal standpoint (see next chart). Similarly, a AAA rating does not guarantee wonderful economic outcomes. But, over time, having one’s fiscal house in order improves the chances of a good long-term economic trajectory.
Sovereign debt ratings by country
Manufacturing construction boom
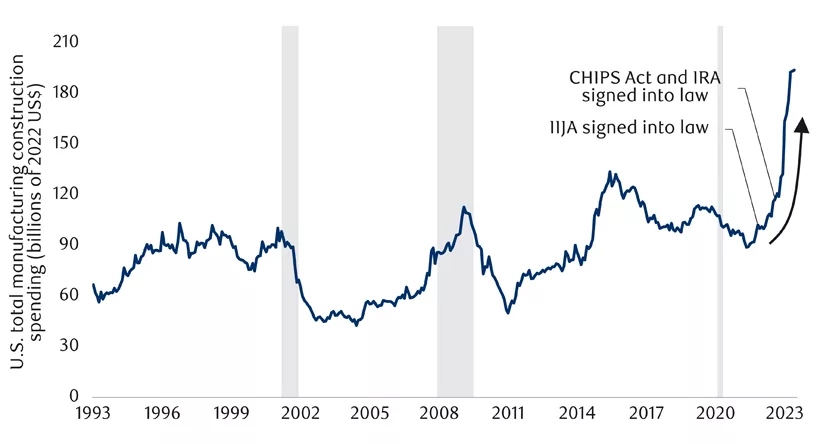
We’ve struggled to assess the scale of the infrastructure boom underway in the U.S. today. We previously wrote that the effect of the Inflation Reduction Act, the CHIPS Act, the Infrastructure Investment and Jobs Act (IIJA) and related policies should have a positive effect on the economy, but not necessarily as large as some imagined.
Consistent with this, overall U.S. private investment in structures is actually down 2.0% over the past year. But that includes residential construction, which is down 14.0% YoY.
You have to dig into the details to see the effect of the fiscal stimulus. The increase in U.S. manufacturing construction spending is undeniably impressive (see next chart). Real spending in the category has roughly doubled over the past few years.
U.S. manufacturing construction spending soared after passage of domestic investment legislation
Might this also reflect an organic inclination to onshore as China becomes less trusted by U.S. businesses? We don’t think that’s been a large motivator, as there is very little evidence of manufacturing construction spending rising outside of the narrow computer-oriented sectors targeted by the CHIPS Act in particular (see next chart).
Recent rise in U.S. manufacturing construction driven by computer, electronic and electrical sector
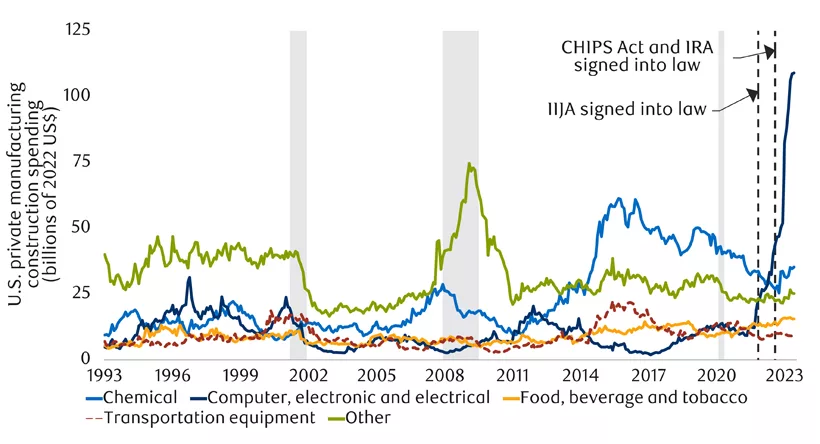
So is this an infrastructure boom or not? It absolutely is for companies that cater to this particular type of activity. But it is narrowly focused, and an additional $100 billion of spending per year adds about 0.5% to GDP – not radically game-changing (and quite similar to our initial estimate made in May).
With contributions from Vivien Lee and Aaron Ma