2022 commenced with inflationary pressures coming to the fore, particularly from oil and energy sources. As inflation in the UK reached new highs, the Bank of England (BoE) swung into action at the start of February, raising the base rate in its second consecutive meeting by a further 0.25% to reach 0.5%. Whilst the scale of the hike was anticipated, the market was shocked by the 5-4 vote, with four dissenters calling for a 0.5% hike. In the same week the Ofgem price cap rise was announced, modestly higher than expectations at an increase of 54%, with a further rise predicted in October.
The unprovoked and widely denounced Russian invasion of Ukraine on 24 February threw the world into disarray. Sanctions were targeted at banks, corporates, and key individuals, ultimately preventing external trade for Russia. Meanwhile, the Western disgust at the Russian targeting of civilians and civilian infrastructure prompted a large-scale exit from Russia of global corporations running the gamut from fashion to oil, McDonald’s to Nike. The actions of the West have crippled the middle class in Russia and delivered a severe shock to the economy, yet the European reliance on Russian energy has further stoked inflation, as the EU and UK in particular look to diversify their energy sources away from Russia.
Despite the potentially recessionary nature of the ongoing conflict, the BoE maintained its policy normalisation trajectory, with a further hike in March of 0.25% bringing the base rate to 0.75%. The surprise this time was in the opposite direction: the vote was split 8-1, with a single member voting for the policy rate to remain unchanged.
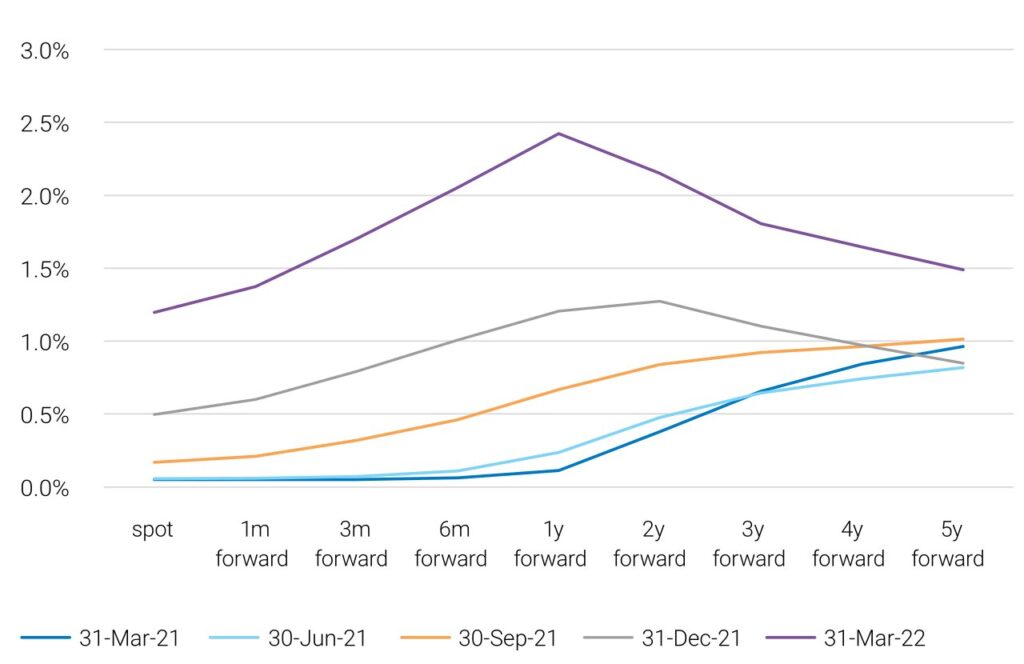
The market’s view of where long-term rates could move to in the future is encapsulated in forward rates. The chart below shows where the six-month SONIA swap rate is currently (spot) and at various forward rates out to five years. In a fashion consistent with the previous quarter, it is anticipated that the Base Rate will rise aggressively but rapidly retrace, with the peak now seen at the one-year forward point. The one year forward rate rose by 1.2% over the quarter reflecting the hawkish tone of the Monetary Policy Committee (MPC).
Six month SONIA rate

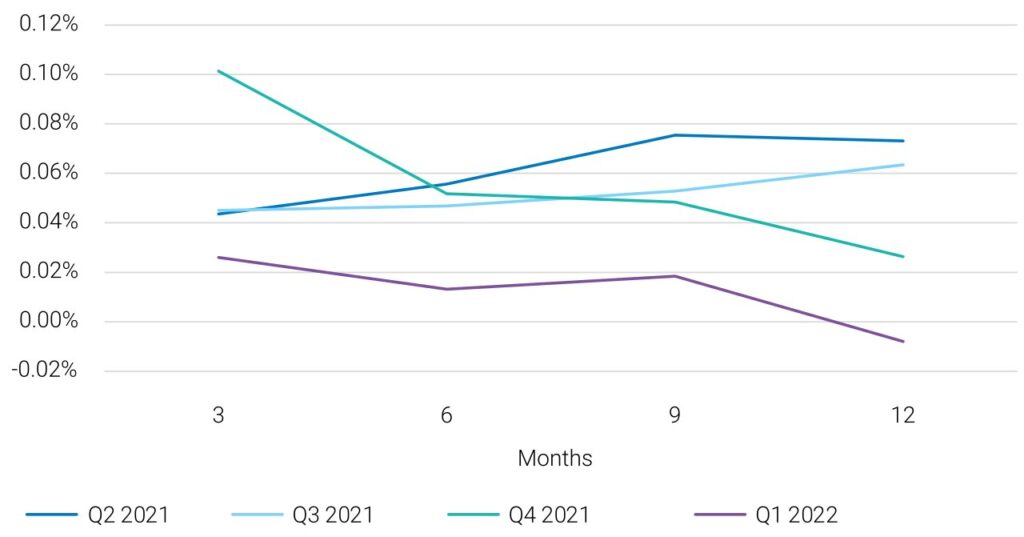
Repo rates are expressed relative to SONIA, and the chart below displays the average repo rates that we have achieved over the past four quarters for three, six, nine and 12-month repos, shown as a spread to average SONIA levels at the time. Repo conditions remain easy with plenty of liquidity available and Active Quantitative Tightening still in the future.
Spread to SONIA

Funding and repo conditions remain favourable for those seeking leverage, reflected in the wide availability of balance sheet and stiff competition keeping spreads at a minimal level. Whilst there has been little change to the headline repo spreads seen in the market, two factors have driven the drop in average repo spreads experienced across all tenors in the first quarter. Quantitative easing provides liquidity to the funding market but has a contrary impact on those bonds that are in high demand, known as trading ‘special’. A significant portion of the sub-10-year sector is locked up on the BoE’s balance sheet, lowering the free market float and accessibility. This consequently means that those who own these special bonds and are prepared to use them for funding purposes can receive a highly beneficial rate, as low as SONIA -0.3%. Our preference is to use special bonds for funding wherever possible and this was a major contributor to the reduction in average repo spreads seen this quarter. The other factor in the compression of repo spreads is due to the intra-day volatility of short-term rates. We transact repo as a fixed rate but convert it to a spread to SONIA to ensure consistency through time by referencing the end of day appropriate SONIA tenor level. In the previous quarter, a drop in levels towards the end of the day resulted in our repo levels appearing larger; this quarter the converse was true, with repos typically executed in the morning and rates rising across the day.
Bilateral repo remains the optimal market access route for liability hedging investors. This is especially true at times such as now where the cost of bilateral repo is so low and thus there is little room for cleared repo to reduce it further. This has served to put a dampener on take-up of alternative repo sources and consequently volumes remain low in such routes as peer-to-peer, direct repo and centrally cleared repo. Electronic trading, however, is swiftly becoming the norm due to operational and pricing efficiencies. Our repo activity is now entirely managed via electronic platforms, bringing resource benefits to both our clients and our counterparties.
Indicative current pricing shows leverage via gilt TRS for a six-month tenor pricing at the same level as repo on average (on a spread to six-month SONIA), although this is very bank dependent and indicative quotes provided can be much wider. Another way to obtain leverage in a portfolio is to leverage the equity holdings via an equity total return swap. An equity TRS on the FTSE 100 (where the client receives the equity returns) would indicatively price around 0.08% higher than the repo (also as a spread to six-month SONIA). However, this pricing can vary considerably from bank to bank and at different times due to positioning, which gives the potential for opportunistic diversification of leverage.

