
Emerging technologies are poised to reduce the steel industry’s environmental impact, creating compelling investment opportunities in the sector
- The transition to a cleaner steel industry is underway, enabled by low-carbon technologies, industry commitments and supportive government policies.
- While reuse of scrap metal is reducing the sector’s carbon intensity and meeting rising demand, the production of primary steel must be fundamentally transformed in order to align the industry with net zero.
- In the short term, steel producers employing electric arc furnaces (EAF) constitute an immediate and durable investment opportunity. Longer-term, emerging technologies and processes, such as direct reduced iron (DRI), need to be scaled up to become cost competitive.
Steel forms the backbone of our built environment, from buildings to vehicles. Global demand for the alloy has roughly trebled since 1970 and is forecast to rise by 50% again by 2050.1,2
Today, the production of steel accounts for an estimated 6% of global greenhouse gas (GHG) emissions and 8% of CO2 emissions.3 The intense heat required to forge new steel in traditional blast furnaces (and associated fossil fuel combustion) makes it one of the more difficult industries to decarbonise. So, while the steel sector will continue to play a central role in the economy, its emissions must be dramatically reduced to achieve national and global net-zero goals.
Each ton of crude steel produced worldwide emits roughly two tons of CO2.4 The industry’s overall carbon intensity is driven by the dominance of blast furnaces, which account for roughly 70% of steel production.5 The process requires temperatures in the range of 1,100°C to 1,600°C, usually achieved by burning coal. In China – which produces a little over half of the world’s steel – blast furnace processes accounted for an estimated 89% of production in 2021.6
Under a business-as-usual scenario, sustained demand growth would drive global steel emissions up by more than one-third by 2050, according to estimates by The Mission Possible Partnership (MPP), an initiative designed to catalyse the decarbonisation of the world’s highest-emitting industries.7 Steel will be core to the infrastructure needed for the clean energy transition, such as power transmission lines and wind turbines; each megawatt of offshore wind capacity demands 250 tons of steel.8
The adoption of new technologies – and the expansion of existing ones – is essential in the industry’s pathway to net zero. In its long-term projections for the sector, the International Energy Agency (IEA) estimates that just over half of 2050 steel production will come from primary production using emerging hydrogen-based processes or carbon capture (see chart below), while scrap-based secondary production will account for 40%.9
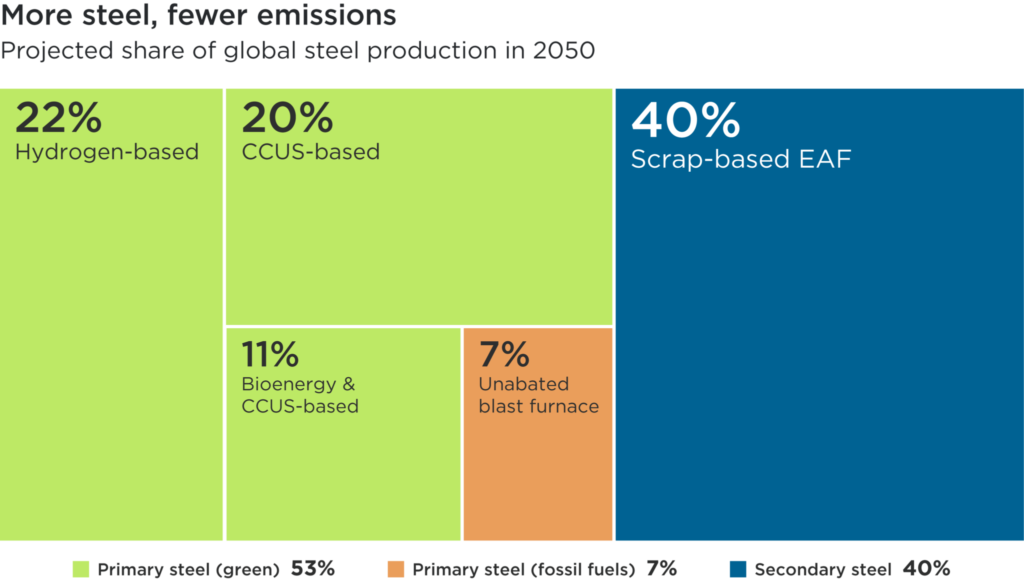
Chart subtitle: Projected share of global steel production in 2050
Overview: This proportional area chart shows the breakdown of projected global steel production in 2050. It’s broken down into three broad categories.
Category one: Primary steel (green)
Category two: Primary steel (fossil fuels)
Category three: Secondary steel
Overall, this chart illustrates that a little more than half of steel production in 2050 is forecast to be primary steel produced using green technologies.
Values: Numerical values presented on the image:
| Primary – hydrogen-based | Primary – CCUS-based | Primary – Bioenergy & CCUS-based | Primary – unabated blast furnace | Secondary – scrap-based EAF |
|---|---|---|---|---|
| 22% | 20% | 11% | 7% | 40% |
Source: IEA, 2020: Iron and Steel Technology Roadmap
Decarbonising primary steel production
The majority of global steel demand will continue to be met by the production of primary steel from iron ore.
A process called direct reduction could hold the key to making primary steel more sustainable. Using a blend of hydrogen and carbon monoxide gas (syngas), iron ore can be reduced without melting it – thereby saving energy. The solid byproduct of this process, direct reduced iron (DRI), is then used as a feedstock into an electric arc furnace (EAF) to roll steel. Today, around 5% of the world’s steel is produced via DRI, but using natural gas instead of syngas. That’s an improvement on current methods, but still emits 1.2 tons of CO2 per ton of primary steel.10
Substituting natural gas with hydrogen derived using renewable electricity could reduce the sector’s 2050 emissions by more than one-third.11 Hydrogen-based DRI, with its potential for 95% GHG reduction, is nearing commercialisation with projects underway from the likes of ArcelorMittal, the world’s second-largest steel producer.12 Additionally, direct reduction with biomass, such as that developed by the Finnish cleantech BMH Technology, offer a 60% reduction and can be integrated into existing plants.
Other innovative green steel technologies are emerging. Boston Metal’s Molten Oxide Electrolysis (MOE) process – which uses renewable electricity to convert iron ore to high-quality liquid metal – targets cost-competitiveness at electricity prices of US$15 to US$35 per MWh.13 Additional promising pathways include Voestalpine’s SuSteel pilot project, which is exploring the use of hydrogen plasma in a carbon-neutral steelmaking process, and flash ironmaking research by the University of Utah.
There could also be an important role for carbon capture, utilisation and storage (CCUS) technologies as part of the industry’s decarbonisation. Under the MPP’s net-zero scenario, up to one-fifth of the industry’s prospective 2050 emissions could be avoided through CCUS. There are currently 30 commercial CCUS projects worldwide.14
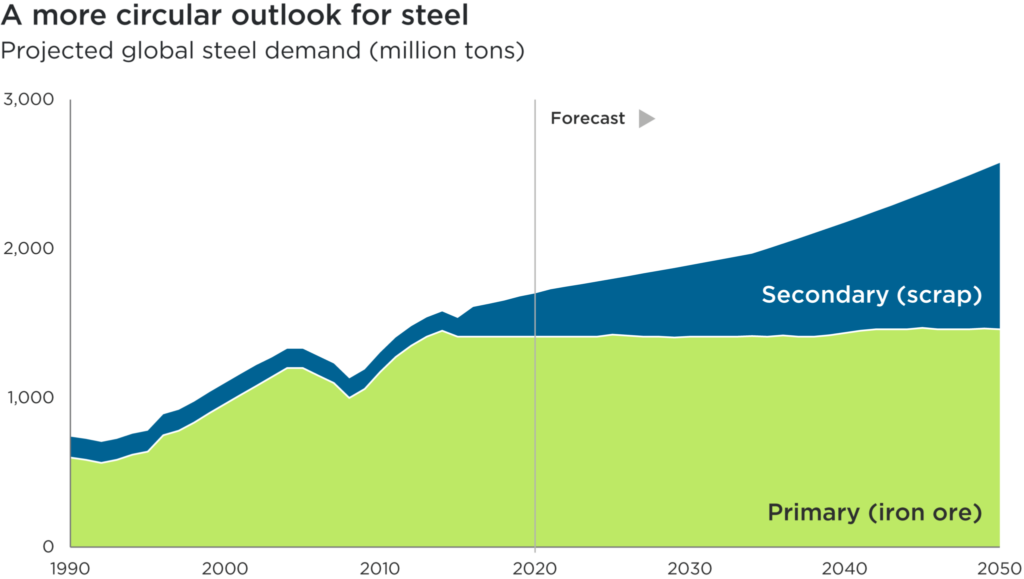
A more circular outlook for steel
Projected global steel demand (million tons)| Year | Primary (iron ore) | Secondary (scrap) |
|---|---|---|
| 1990 | 600 | 140 |
| 1991 | 585 | 140 |
| 1992 | 565 | 140 |
| 1993 | 585 | 140 |
| 1994 | 620 | 140 |
| 1995 | 640 | 140 |
| 1996 | 750 | 140 |
| 1997 | 780 | 140 |
| 1998 | 835 | 140 |
| 1999 | 900 | 140 |
| 2000 | 960 | 140 |
| 2001 | 1,020 | 140 |
| 2002 | 1,080 | 140 |
| 2003 | 1,140 | 130 |
| 2004 | 1,200 | 130 |
| 2005 | 1,200 | 130 |
| 2006 | 1,150 | 130 |
| 2007 | 1,100 | 130 |
| 2008 | 1,000 | 130 |
| 2009 | 1,061 | 130 |
| 2010 | 1,175 | 130 |
| 2011 | 1,275 | 130 |
| 2012 | 1,350 | 130 |
| 2013 | 1,410 | 130 |
| 2014 | 1,450 | 130 |
| 2015 | 1,410 | 125 |
| 2016 | 1,410 | 200 |
| 2017 | 1,410 | 220 |
| 2018 | 1,410 | 243 |
| 2019 | 1,410 | 270 |
| 2020 | 1,410 | 290 |
| 2021 | 1,410 | 318 |
| 2022 | 1,410 | 335 |
| 2023 | 1,410 | 353 |
| 2024 | 1,410 | 370 |
| 2025 | 1,425 | 373 |
| 2026 | 1,417 | 399 |
| 2027 | 1,410 | 424 |
| 2028 | 1,410 | 443 |
| 2029 | 1,405 | 466 |
| 2030 | 1,410 | 480 |
| 2031 | 1,410 | 499 |
| 2032 | 1,410 | 518 |
| 2033 | 1,410 | 537 |
| 2034 | 1,415 | 552 |
| 2035 | 1,410 | 590 |
| 2036 | 1,419 | 615 |
| 2037 | 1,410 | 659 |
| 2038 | 1,410 | 694 |
| 2039 | 1,420 | 720 |
| 2040 | 1,435 | 741 |
| 2041 | 1,450 | 763 |
| 2042 | 1,460 | 791 |
| 2043 | 1,460 | 829 |
| 2044 | 1,460 | 868 |
| 2045 | 1,470 | 897 |
| 2046 | 1,460 | 948 |
| 2047 | 1,460 | 989 |
| 2048 | 1,460 | 1,030 |
| 2049 | 1,465 | 1,067 |
| 2050 | 1,460 | 1,116 |
Overview: This stacked area chart shows the breakdown in estimated demand for primary and secondary (scrap) steel between 1990 and 2050.
Category one: Primary (iron ore)
Category two: Secondary (scrap)
Overall, this chart illustrates that secondary (scrap) steel is forecast to meet rising global demand for steel though primary steel production is forecast to remain greater.
Presentation
This stacked area chart illustrates the breakdown in rising global steel demand from 1990 to 2050.
Source
World Economic Forum / ArcelorMittal, 2023. Forecast data from 2020 to 2050
Making more use of scrap metal
Alongside the greening of primary steel production over the coming decades, an expanding role for secondary or scrap steel will help reduce the sector’s emissions intensity in the medium term.
It is forecast that electric arc furnace (EAF) technology, which already supplies one-quarter of global steel demand, will produce roughly 40% by 2050.15 EAF uses electricity to melt down and re-use scrap steel. Emissions from EAF are highly dependent on how electricity is generated locally, but average 0.5 tons of CO2 per ton of steel produced – and less where only renewable electricity is used.16 Increased scrap use could reduce the industry’s prospective 2050 emissions by up to one-fifth under the MPP net-zero scenario.17
The US currently leads in secondary steelmaking, with EAF-based processes accounting for 70% of domestic output in 2019.18 Other major steel producers are also looking to make more use of scrap steel: China is aiming for between 15% and 20% EAF-based production by 2025, while India is already at 54%.19,20 However, it’s important to note that feedstocks in developing economies can sometimes include carbon-intensive pig iron (not only scrap) and electricity is in many cases generated largely by coal. A transition to scrap feedstocks and the use of renewable energy will be needed to enable deeper emissions cuts from EAF.
Improving credit among secondary steelmakers
We believe the investment opportunities that will be created by technological and market drivers in the transition to a greener steel industry are well illustrated by the market response to EAF.
The financial health of EAF steel producers in the US has improved over the past decade or so. Using a peer group comprised of EAF producers Nucor, Steel Dynamics and Commercial Metals, we compared ‘pureplay’ companies against steelmakers reliant on blast furnace production
The improving financial health of US EAF producers is reflected in key metrics. We observe in the chart below that average net leverage – as measured by net debt to EBITDA – has decreased significantly for EAF producers since 2015.21 Over the same time, profit margins have increased to an average of 19%. This compares with average margins of 11% among their traditional steelmaking peers.22
Reduced debt and improved profitability are driving higher credit ratings. From 2015 to 2023, credit quality for the EAF peer group improved from an average senior unsecured credit rating of ‘Ba1’ to ‘Baa3’, according to Moody’s, thereby moving to investment grade.23
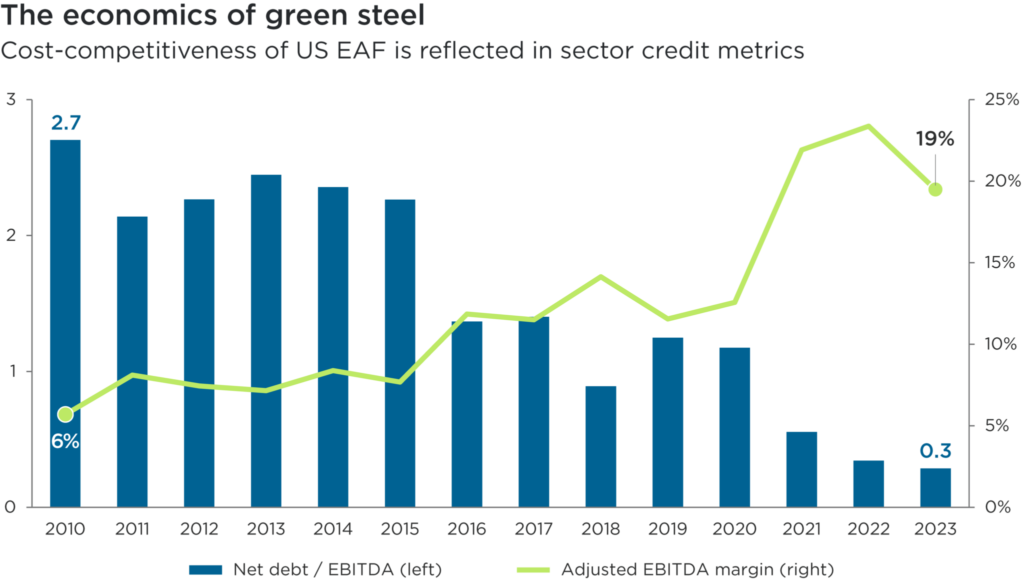
The economics of green steel
Cost-competitiveness of US EAF is reflected in sector credit metrics| Year | Net debt / EBITDA | Adjusted EBITDA margin |
|---|---|---|
| 2010 | 2.7 | 5.7% |
| 2011 | 2.1 | 8.1% |
| 2012 | 2.3 | 7.4% |
| 2013 | 2.4 | 7.1% |
| 2014 | 2.4 | 8.4% |
| 2015 | 2.3 | 7.7% |
| 2016 | 1.4 | 11.9% |
| 2017 | 1.4 | 11.5% |
| 2018 | 0.9 | 14.1% |
| 2019 | 1.2 | 11.6% |
| 2020 | 1.2 | 12.6% |
| 2021 | 0.6 | 21.9% |
| 2022 | 0.3 | 23.4% |
| 2023 | 0.3 | 19.5% |
Overview: This column and line chart series compares the falling ratio of net debt to earnings with rising earnings margins among US EAF producers, between 2010 and 2023.
Category one: Net debt / EBITDA
Category two: Adjusted EBITDA margin
Overall, this chart illustrates the improving financial metrics among the peer group of US EAF producers over the time period.
Presentation
This column and line chart illustrates the financial health of US EAF producers over the past decade or so.
Source:
Impax analysis based on company filings, April 2024. The EAF peer group, as defined by Impax, is comprised of three US steelmakers that use EAF methods: Commercial Metals, Nucor and Steel Dynamics. EBITDA is a standard metric for company profitability that is calculated using earnings before interest, tax, depreciation and amortization
Commitments and policies are galvanising the transition
The development of low-carbon technologies for steel production isn’t the only force driving the industry’s transition: corporate commitments and supportive government policy are also accelerating changes.
Steelmakers are increasingly setting ambitious emissions targets. In line with guidance from the Science-Based Targets initiative (SBTi), more than 20 steel companies have validated near-term science-based targets, with 19 committing to net-zero emissions.24 Initiatives from non-governmental organisations like MPP are further accelerating the industry’s transition towards net-zero goals.
In parallel, policy support is emerging in the form of incentives, regulations and tariffs to align steelmaking with national climate targets. As an example of the former, Germany’s current €23bn ‘net zero’ budget includes ‘climate protection contracts’ that subsidise companies adopting cleaner steelmaking technologies.25 Tightening caps on GHG emissions under the EU Emissions Trading System will meanwhile improve the competitiveness of less polluting technologies by raising the relative long-term cost of blast furnace steel. To help ensure a level playing field with steel produced elsewhere, the EU’s Carbon Border Adjustment Mechanism puts a price on carbon-intensive imports.
Forging new markets
The rate of change will also be informed by end-user appetite for less emissions-intensive steel. Encouragingly, strong market demand for sustainably produced primary steel has recently been evidenced by the premium pricing commanded by H2 Green Steel, an early-stage Swedish maker of primary steel using a green hydrogen-fuelled DRI process.26
Under the First Movers Coalition, some of the world’s largest companies are using their purchasing power to create early markets for innovative technologies in hard-to-abate sectors, including steel. Ørsted, the world’s largest offshore wind developer, has partnered with turbine manufacturer Vestas to procure turbine towers made from scrap using renewable electricity, reducing carbon emissions by up to 70%.27
We see the convergence of promising technologies, ambitious industry goals and supportive policy creating fertile ground for long-term investment in companies enabling the transition to a greener steel sector.
1 Kim, J., et al., 2022: Decarbonizing the iron and steel industry: A systematic review of sociotechnical systems, technological innovations, and policy options. Energy Research & Social Science
2 World Economic Forum / ArcelorMittal, 2023
3 IEA, 2023World Energy Outlook 2023
4 Mission Possible Partnership, 2022: Making net-zero steel possible. Scope 1 and 2 emissions only
5 Mission Possible Partnership, 2022: Making net-zero steel possible. Scope 1 and 2 emissions only
6 World Steel, 2023: World Steel in Figures 2022
7 Mission Possible Partnership, 2022: Making net-zero steel possible
8 Nucor, 2022, Investor Day Presentation
9 IEA, 2020: Iron and Steel Technology Roadmap
10 Mission Possible Partnership, 2022: Making net-zero steel possible
11 Mission Possible Partnership, 2022: Making net-zero steel possible
12 World Steel, 2022: Crude steel production by tonnage
13 Boston Metal, 2019: Steel production through electrolysis: impacts for electricity consumption
14 International Institute for Sustainable Development, 2023: Unpacking Carbon Capture and Storage: The technology behind the promise
15 World Economic Forum / ArcelorMittal, 2023
16 Mission Possible Partnership, 2022: Making net-zero steel possible
17 Mission Possible Partnership, 2022: Making net-zero steel possible
18 World Economic Forum, 2023: What is steel scrap and how can it help us reach net zero?
19 S&P Global Commodity Insights, 2022: China’s EAF capacity growth gathers pace in 2022
20 SteelMint India, 2023: India’s steel demand to touch 190 MT-Mark in 2030
21 Earnings before earnings before interest, tax, depreciation and amortisation (EBITDA) is a standard metric for company profitability
22 Profitability as measured by EBITDA (earnings before income, tax, depreciation and amortisation)
23 Moody’s, as at the end of 2023. Moody’s defines ‘investment grade’ debt as ratings of ‘Baa3’ and up
24 Science-Based Targets initiative, 2023: World’s Steel Industry set for Transformation with First-Ever 1.5°C Science-Based Decarbonization Guidance
25 Bloomberg, 27 March 2024: Germany’s €23 Billion Green Experiment to Save Its Industrial Economy
26 TXF News, 23 January 2024: H2 Green Steel Boden – Long on ambitions, low on emissions
27 World Economic Forum, 2023: 4 breakthrough actions to decarbonize steelmaking
References to specific securities are for illustrative purposes only and should not be considered as a recommendation to buy or sell. Nothing presented herein is intended to constitute investment advice and no investment decision should be made solely based on this information. Nothing presented should be construed as a recommendation to purchase or sell a particular type of security or follow any investment technique or strategy. Information presented herein reflects Impax Asset Management’s views at a particular time. Such views are subject to change at any point and Impax Asset Management shall not be obligated to provide any notice. Any forward-looking statements or forecasts are based on assumptions and actual results are expected to vary. While Impax Asset Management has used reasonable efforts to obtain information from reliable sources, we make no representations or warranties as to the accuracy, reliability or completeness of third-party information presented herein. No guarantee of investment performance is being provided and no inference to the contrary should be made.