As humans, we are culturally programmed to react and bond with stories. Creating stories and narratives is our way to make sense of a complex and unruly world. Looking back at the first half of 2021, the main story in markets has been “the Cyclical recovery”. This was seen in sectors that suffered in 2020 rebounding and the value factor making a comeback, among other things. Another way to say it is that we have been experiencing a “Junk Rally”.
However, the tide is turning, and narratives have been shifting. Early-cycle opportunities may have already played out. The high beta rally of the first six months of 2021 cannot be expected to continue indefinitely. With increasing fear of the delta variant, as well as elevated market multiples, it may be time to start looking at mid-cycle winners, such as the quality factor.
Historically, quality stocks (high profitability, low debt) have tended to fare very well in such mid-cycle periods. Such stocks usually exhibit high pricing power and a strong balance sheet which helps them face rising costs and compressing margins.
The end of the Junk Rally
WisdomTree developed a composite risk score (CRS) comprising multiple measures of profitability/quality combined with risk-adjusted momentum. This score can be used to differentiate between lower risk and higher risk stocks over time.
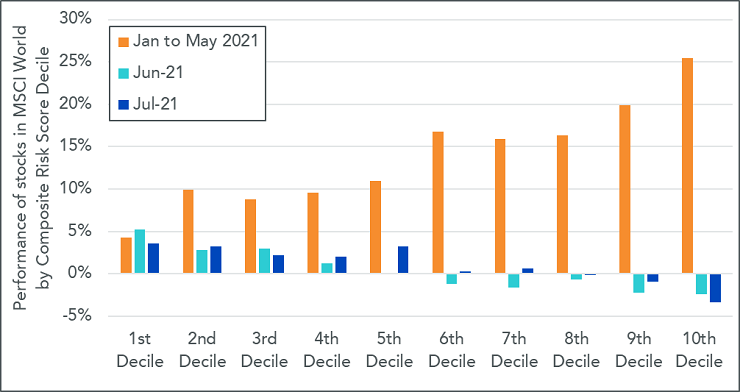
In Figure 1, we look at the performance, over different periods in 2021, of the stocks in the MSCI World grouped using the composite risk score. The 1st decile regroups the 10% of stocks with the highest score, i.e. the highest quality and lower risk. The 10th decile groups the 10% of stocks with the lowest score.
Looking at the performance of the different stocks in the MSCI World index, we observe that the market experienced a serious Junk Rally over the five first months of the year. The riskiest stocks performed the best for that period (up to the end of May 2021). The 10th decile returned 25.42% over those five months. The 9th decile returned 19.9%. In contrast, the less risky, higher quality stocks in the first decile returned only 4.3%, and the 2nd decile returned a barely improved 9.9%. Overall, in 5 months, the best decile underperformed the worst decile by a stunning 21.1%.
In June and July, however, the situation has normalized. Over the two months, the higher quality stocks have started to catch up. The less risky stocks have performed positively in both months, while the riskiest stocks have lost ground.
Figure 1: Performance of MSCI World stocks by Composite Risk Score decile in 2021.

Historical performance is not an indication of future performance, and any investments may go down in value. You cannot invest directly in an index.
While one or two months do not guarantee a changing trend, over the long run, we would expect the lower risk, higher quality stocks to deliver a smoother ride for investors.
As discussed recently in one of our blogs, traditional finance theory posits that higher-quality stocks should outperform and be more expensive than their lower quality counterpart. However, we know that the world is complex and that the market is not perfectly efficient. Therefore reality can play out differently. We observe currently that on the back of the “Junk Rally” discussed above, high-quality stocks are trading at relatively low multiples.
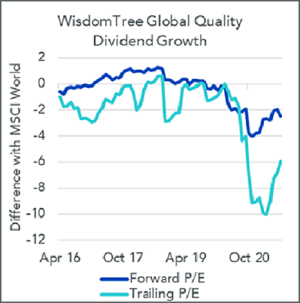
Looking at the WisdomTree Global Quality Dividend Growth index as one proxy for quality stocks, the forward price to earnings ratio (P/E) is currently close to a historic low. The index used to trade at a premium to the benchmark, and it is now trading at a discount of -2.5 (17.5 Forward P/E for the Quality index versus 20 for the MSCI World), having reached -4 recently.
On a Trailing P/E basis, the story is exacerbated further. Coming out of the global pandemic where companies with weaker balance sheets may have disproportionately suffered, investors’ renewed optimism may have buoyed prices for lower-quality stocks as we return to an environment of global economic growth. Lower-quality companies enjoyed a tailwind, thereby reducing the valuation premium that high-quality stocks have traditionally commanded over the broader market. This is particularly evident in these 12m trailing earnings. The trailing P/E at the end of July was 20.6 for the Quality index versus 26.8 for the MSCI World.
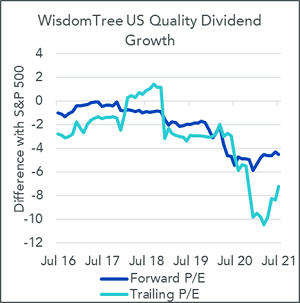
Figure 2: Forward and Trailing P/E of WisdomTree Global and US Quality dividend growth indices over the last five years


Source: WisdomTree, Factset. As of 31/07/2021
Historical performance is not an indication of future performance, and any investments may go down in value. You cannot invest directly in an index.
For US equities, using the WisdomTree US Quality dividend growth index, the story is similar. While the index never traded at a substantial premium to the S&P 500 on a Forward P/E basis, the discount observed in the last few months is significantly deeper, with a current level at -4.5 (17.7 Forward P/E for the quality index versus 22.2 for the S&P 500).
Conclusion
Overall, stars could be aligning for quality:
- the Junk Rally may be reaching its end, with the S&P 500 having more than doubled since its low in March 2020 and the delta variant putting some stress on the economic recovery
- high-quality equities trade at a discount to the market but also versus low-quality equities, which is not the normal state of affairs
- flows in flows into exchange traded funds (ETFs) have started to turn away from value and toward quality orientated strategies, but any possible transition is still in its early days

