
Recent central bank actions and currency interventions have created shock volatility in the markets, leading to large-scale position selling across the world, but in East Asia in particular. On Monday, Japan’s Nikkei 225 dropped over 10%1, one of the biggest moves since the 1987 crash. The market has largely stabilised as we write.
Japan has been one of our top long-term favourite markets. This short-term turmoil has brought an influx of inbounds as to whether we are still bullish and enquiries about how to handle the currency hedging question.
Our house view is that this sell-off is likely to be is an attractive buying opportunity.
To summarise:
What changed?
- Narrative Wise: Quite a bit. Soft US labour and inflation readings led to fear that the Federal Open Market Committee (FOMC) was making a policy mistake by keeping rates in the current 5.25-5.50% band. This led to the anticipation of deeper and quicker rate cuts.
- Elsewhere: The Bank of Japan raised rates marginally last week, from a 0.0-0.10% range to “around 0.25%,” along with some hawkish plans regarding quantitative tightening (QT). Combined with the perceived shift in the outlook for the FOMC, this led to a dramatic unwind in leveraged positioning across the USD/JPY complex.
It is important to point out that currencies trade on the future, not the present, and the future differential between US and Japanese yields narrowed quickly. In response, the yen snapped stronger.
What didn’t change?
- Fundamentally: Labour market indicators softened but remained positive. US manufacturing remains weak and disappointing, but this is the status quo. We and others have been highlighting the pain in domestic manufacturing for the better part of 18 months. The services sector – the largest component of the US economy – remains in expansion mode, although the Street consensus is that this former strong point is weaker than in 2022 and 2023.
- In Japan, interest rates were increased because the economy is moving along satisfactorily. There is no champagne or fireworks out of Japan, but its Tankan surveys are in expansion mode (Figure 1).
Figure 1: Japan’s PMIs are diverging from the US
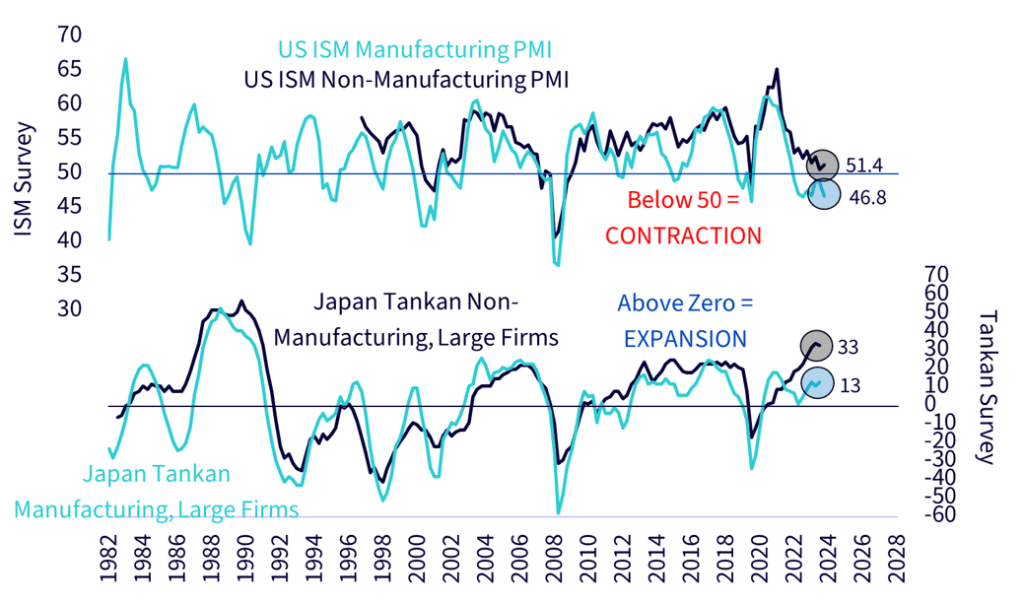
Source: Refinitiv, ISM, Bank of Japan, as of July 2024 for the US and Q2/2024 for Japan. ISM Survey is a survey of purchasing managers at manufacturing firms across the US, providing US Purchasing Managers’ Index (PMI). Tankan Survey is an economic survey, providing insights into the business conditions, sentiment, and business plans of major Japanese companies. The manufacturing and non-manufacturing indices rate the relative level of general business conditions in the manufacturing and non-manufacturing segments. You cannot invest directly in an index. Historical performance is not an indication of future performance and any investments may go down in value.
US interest rate outlook: The jobs report suggests the labour market was cooling, not falling off a cliff. Against that backdrop, the Treasury rally could very well be overextended.
- In Japan: Nothing changed, as far as we can tell. Aside from the Bank of Japan (BoJ) signalling confidence that it could move the policy rate higher, the main bullish drivers, such as corporate governance reform, have witnessed no material news flow in either July or August. The country is flirting with an inflationary vibe for the first time in decades; JPY at ¥144.8 drives that impulse. Though it is stronger than where the market stood last week, it remains remarkably accommodative.
Figure 2: The yen’s post-COVID-19 weakness has ushered in an inflationary backdrop
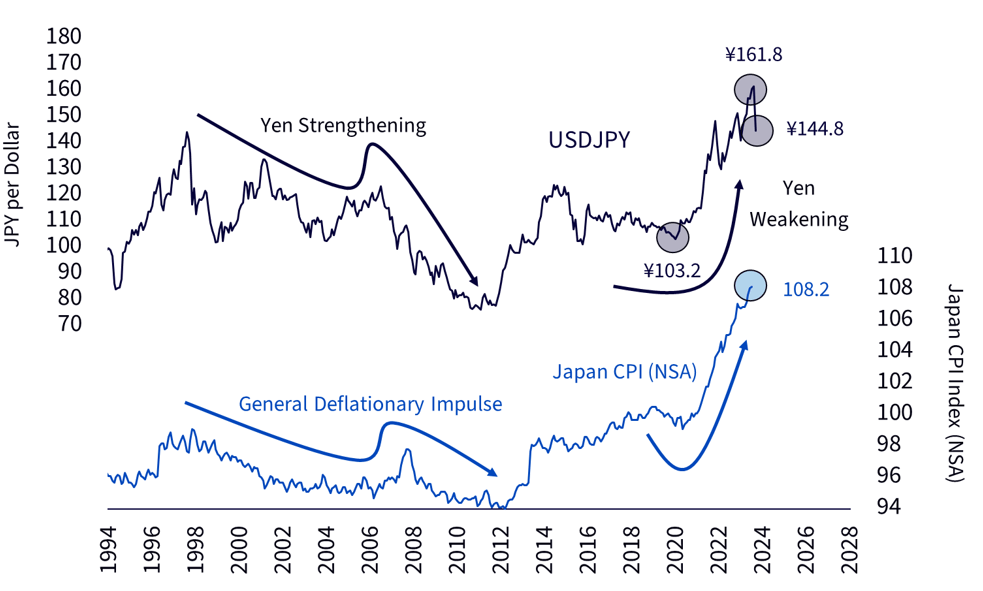
Source: Refinitiv, Statistics Bureau, Ministry of Internal Affairs & Communication, Japan, as of June 2024 for CPI. JPY exchange rate as of 06 August 2024. You cannot invest directly in an index. Historical performance is not an indication of future performance and any investments may go down in value.
- The potential opportunity: A few Japanese companies will be negatively affected by the change in FX cross rates. But many had already issued earnings guidance based on an exchange rate in the ¥140s. JPY weakened rapidly earlier this summer to ¥162. This move snapped the pair back into the ¥140s, where the exchange rate last rested in Q1.
Japanese equities crashed because levered market participants received margin calls, not because the fundamental outlook for Corporate Japan has changed.
Over the long run, currency risk brings added volatility and an extra bet, which is not core to a long Japan thesis, which we think rests primarily on relative valuations.
The country has positive catalysts, namely the follow-through on corporate promises we have highlighted for years. The big one is the “Name and Shame List”, which identifies companies that have not fixed their profitability metrics. The Tokyo Stock Exchange threatened it, and many shook their heads and said it would never happen. Then, voila, the Tokyo Stock Exchange (TSE) called those bluffs and published the list right there on the home page of their website.
Additionally, we would be remiss if we didn’t give a hat tip to the country’s position as a friendly player in Washington. It offers a geopolitical tailwind if China’s hawkishness accelerates or stays even keel. Regarding Trump tariffs, this has been a known quantity for how many months, if not years? Markets move on surprises; a 10% tariff on Japanese exports is so well-telegraphed that it would surprise zero Japan watchers.
We believe a hedged-currency Japan position should outperform the S&P500 over the next five years.
Consider our arithmetic:
The S&P 500 is priced at 21 times earnings2. The reciprocal is the earnings yield, which is less than 5%. Add expected inflation of 2-3% to arrive at a medium-term return estimate for the S&P 500 of maybe 7-8%.
Now Japan. If we own equities with a currency hedge, which is how most WisdomTree investors do it, the carry from the currency forward contracts is above 5% at the moment. It is now “everyone’s” base case that the Fed and Bank of Japan will change that, so let’s price in a slide in this gap between US and Japanese short rates to something like 3% in 2025.
The WisdomTree Japan Equity UCITS ETF – USD Hedged (DXJ), our flagship currency-hedged equity ETF, is priced at 11-12 times earnings3. The reciprocal of that is the earnings yield, about 9%. Add the aforementioned carry of ~3%, and the combination presents nominal returns from this exercise of more than 12%.
When comparing a country with a sub-11 forward P/E (Japan) and one whose P/E is 21 (the US), we must check for an earnings growth disparity. But we can’t find one, at least not a big one. The Street consensus is for Japanese corporate earnings to grow in the high single-digit area for the fiscal year ending March 2025. This is not far off FactSet’s 2024 S&P 500 earnings growth aggregation, which indicates a 10.7% YoY rise.
In Japan’s case, it is a misnomer that earnings estimates would be revised down from the yen’s sudden appreciation; many Japanese corporates were guiding earnings based on an exchange rate in the ¥142-144 area. It was trading there, then it bolted into the ¥160s – and now it has bolted back there once again. A round trip.
Additionally, we remain stunned at how little attention Japan’s cost of labour arbitrage receives in secular outlooks.
Figure 3: Japan wages vs. United States wages (USD Terms)
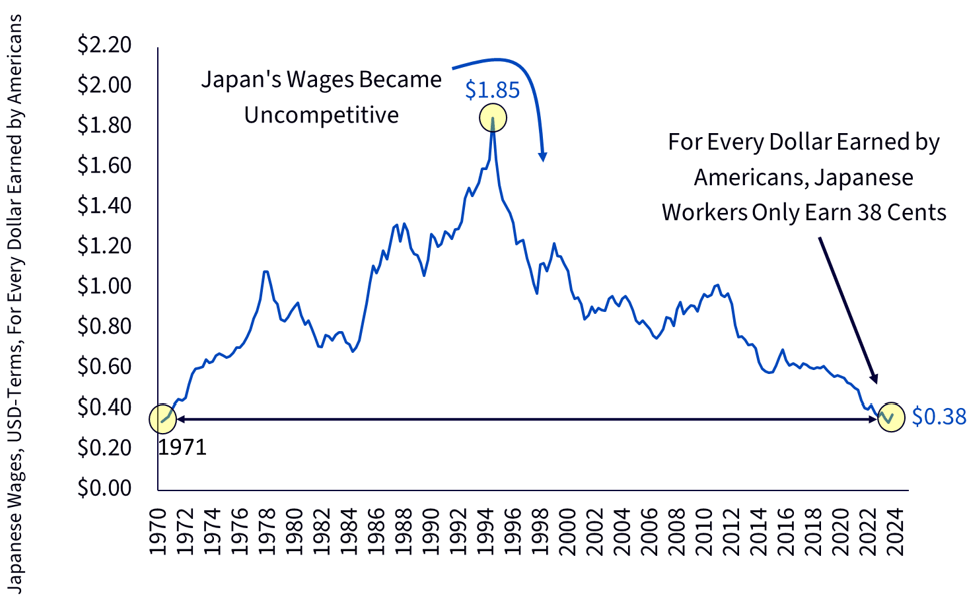
Source: Refinitiv, OECD, as of Q3 2024 with currency conversion as of 06 August 2024. Historical performance is not an indication of future performance and any investments may go down in value.
Is it time to take off the yen hedge?
Remember, we have been doing this for a couple of decades, so at this point, WisdomTree has many ETFs, some of which hedge the currency and others that do not. Which angle to take is often a matter of personal preference, but allow us to present the Berkshire Hathaway case study, which we think is helpful.
The reader may be aware that Berkshire Hathaway bought half a dozen Japanese trading houses a couple of years back. With respect to the yen risk, two paths could have been taken.
One was simple: Berkshire Hathaway could have converted the massive USD cash stockpile (which currently amounts to $277bn after Berkshire Hathaway’s recent Apple sales) into JPY to buy the stocks. End of story.
Instead, Warren Buffett argued that neither he nor his deputies had any unique insight into future forex moves. Berkshire Hathaway tapped the market with JPY debt to finance the Japanese equity long. In so doing, Berkshire Hathaway “went the DXJ route” and removed the yen part of the calculus from the mix.
Picking up the pieces
What we just witnessed was the worst three-day crash for Japan’s stock market in data to 1973. After the prior crashes, the median subsequent 12-month stock market return was 10.9%; the average was 14.6% (Figure 4). This includes the miserable 1990 experience when Japan’s bubble was bursting. If we draw a line through 1990, which we think is reasonable given the stock market’s bubble status at the time (compared to today’s 10-11 forward earnings multiple), that makes the lookback even more compelling.
As with many market crashes, buying after a panic is generally a profitable move.
Figure 4: Japan’s performance after crashes
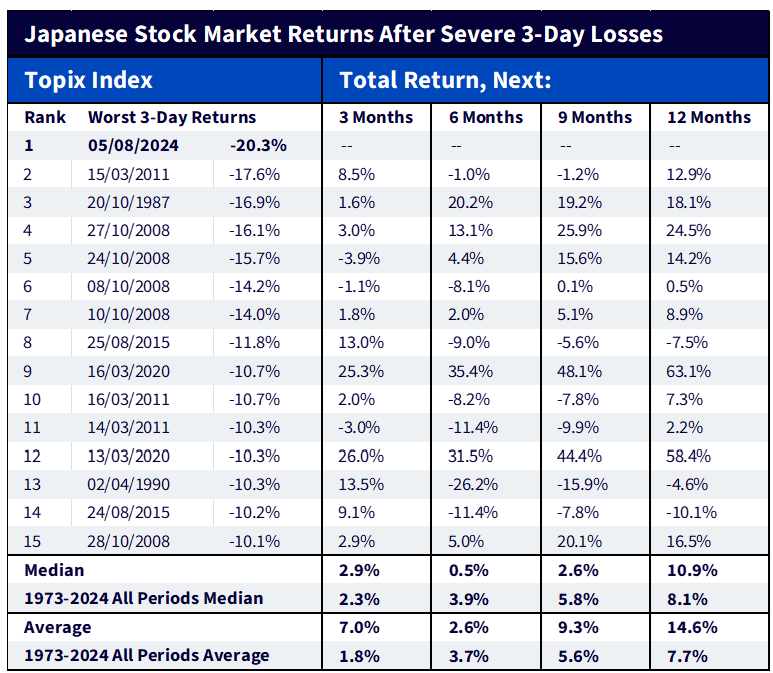
Source: Refinitiv, from 04 January 1973 to 06 August 2024, in JPY. TOPIX index denotes Tokyo Stock Price Index. You cannot invest directly in an index. Historical performance is not an indication of future performance and any investments may go down in value.
Source
1 Bloomberg
2 Bloomberg, as of 06 August 2024
3 WisdomTree, FactSet, as of 06 August 2024