

Amid mounting fiscal, monetary, and trade policy uncertainties, U.S. equity market volatility has surged over the first few months of 2025, with the S&P 500 falling into a -10% correction from its prior high.1 What might history tell us about the frequency and magnitude of market pullbacks and how long-term investors might navigate market volatility going forward?
- Over the past few months, equity investors have struggled to determine how government spending cuts, evolving trade tariffs, and monetary policy signals from the Federal Reserve will impact U.S. economic growth going forward. Consequently, U.S. equity markets may already reflect these potential economic headwinds. While market pullbacks can be difficult for long-term investors, they are inevitable. However, periods of uncertainty often reveal potential opportunities to acquire quality companies at more attractive valuations.
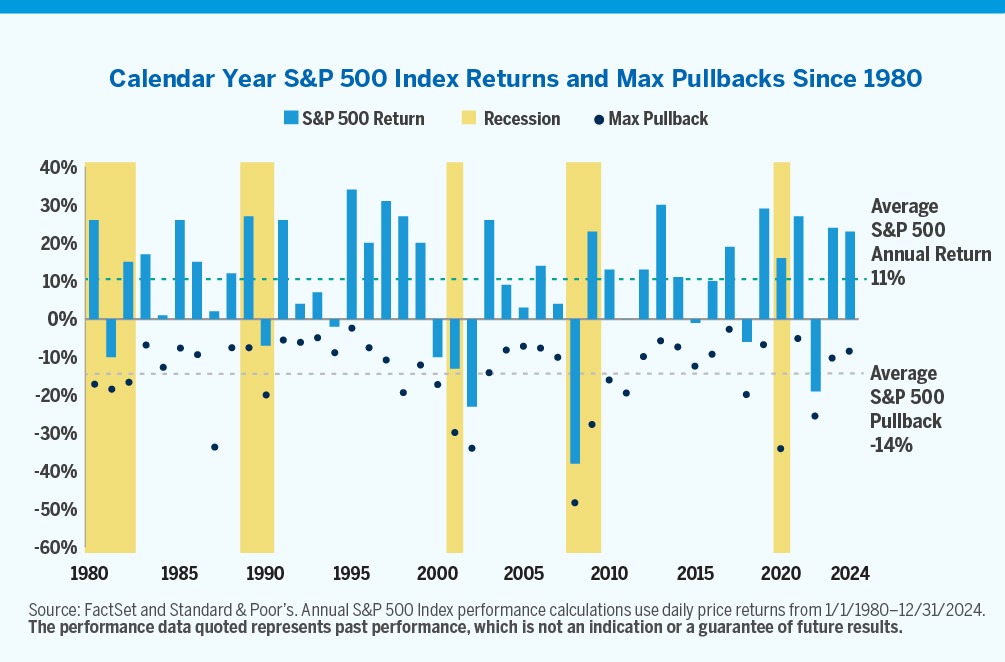
- From 1980 through 2024, the average intra-year S&P 500 pullback has historically been around -14% per calendar year, while the average calendar year return of the S&P 500 has been approximately 11% as shown in the chart above. Moreover, while the magnitude of historical pullbacks has often been severe during economic recessions (shaded in yellow), there have only been three instances when the S&P 500 fell below -14% for the calendar year.
- Although safe havens like cash or Treasury Bills may seem attractive during periods of heightened volatility, history suggests that equities are more likely to outperform them over longer holding periods (see The Power of Patience). While U.S. economic growth may be slowing in the near-term, we contend that the true drivers of long-term shareholder value are innovation and productivity. Furthermore, we believe growth stocks may be well-positioned to benefit from the increased pace of innovation in areas such as artificial intelligence and digital transformation, where long-term fundamentals remain compelling.