

With markets volatile as inflation forces central banks’ hands, investors can reference these indicators to decipher what may be next for the global economy and financial markets.
Key takeaways
- The trajectory of inflation will be a key determinant of how aggressive central bankers must be in tightening monetary policy.
- Central banks are tasked with threading a needle between reeling in inflation and avoiding sending the economy into recession.
- While higher policy rates have weighed on both equity and bond valuations, corporate earnings have, thus far, been resilient and fixed income securities offer yields unavailable only a few months ago.
Financial markets have proven volatile in 2022 – with the first weeks of May being the latest dramatic example – as investors adjust to a regime of tighter monetary policy. Rather than confronting less accommodation, market participants are instead facing actual monetary tightening. Interest rates are rising and central bank balance sheets are poised to shrink. As these developments unfold, asset prices stand to lose much of the support extraordinarily friendly policy has provided them over the past 10-plus years.
To better grasp the magnitude of this paradigm shift – and identify what to watch for in coming months – we have highlighted a few data series that, in our view, capture what is behind the change in policy and how they are reverberating through financial markets.
Global inflation – too much of a “good” thing
Recessions caused by natural disasters – including pandemics – tend to be short-lived, and this was largely the case with COVID-19. Yet rebounding demand was accompanied by pandemic-related supply chain disruptions, labour shortages and a wave of liquidity unleashed by global central banks. All of these have contributed to inflation rates especially in developed countries – reaching multi-decade highs.
2021 and 2022 (Estimated) Year-Over-Year Inflation
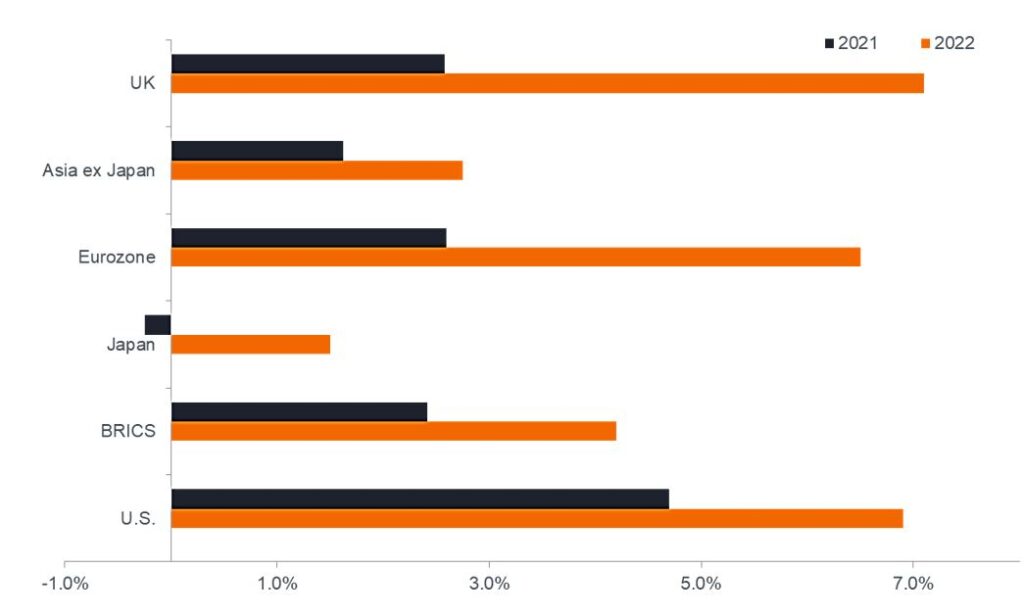
These ingredients were already in place before Russia’s invasion of Ukraine upended the market for energy products and other commodities originating in Eastern Europe.
With headline consumer price inflation at 8.5% in the US, the Federal Reserve (Fed) has had to acknowledge that its transitory inflation call was incorrect and it must pull forward its policy normalisation program, with last week’s 50 basis point (bps) hike the latest salvo. Typically, inflation caused by supply constraints is less responsive to rate increases, but with rising prices pushing otherwise impressive wage growth into negative territory in real – inflation-adjusted – terms, the US central bank had little choice but to act.
Even with the federal funds rate having already been raised by 75 bps, consensus calls for inflation to remain elevated for the remainder of the year. This is due to the lag between a rate increase and its impact on economic activity. Fed Chairman Jerome Powell seems to pin the Fed’s hopes on supply dislocations and labour shortages eventually being resolved. Yet, another ingredient of inflation is consumer expectations. If concerns about persistently rising prices become embedded in consumer psychology, inflation can become a self-fulfilling prophecy, likely manifested in an upward wage-price spiral.
The hope is that the Fed can engineer a soft landing by tightening financial conditions without causing a recession. Even then, however, annual inflation will likely normalise at a rate higher than the 1.5% it averaged for much of the post Global Financial Crisis (GFC) era.
All eyes on the Fed
During the decade-plus of highly accommodative policy, the Fed consistently undershot its own expectations for rate increases – a point seen by the seven years it kept its benchmark rate at the zero bound. The current meteoric leap in prices – if not having fully dispatched – has at least weakened the Fed’s propensity for profound dovishness.
Evolution of Federal Reserve’s “DOTS” Survey of Future Policy Rate Path
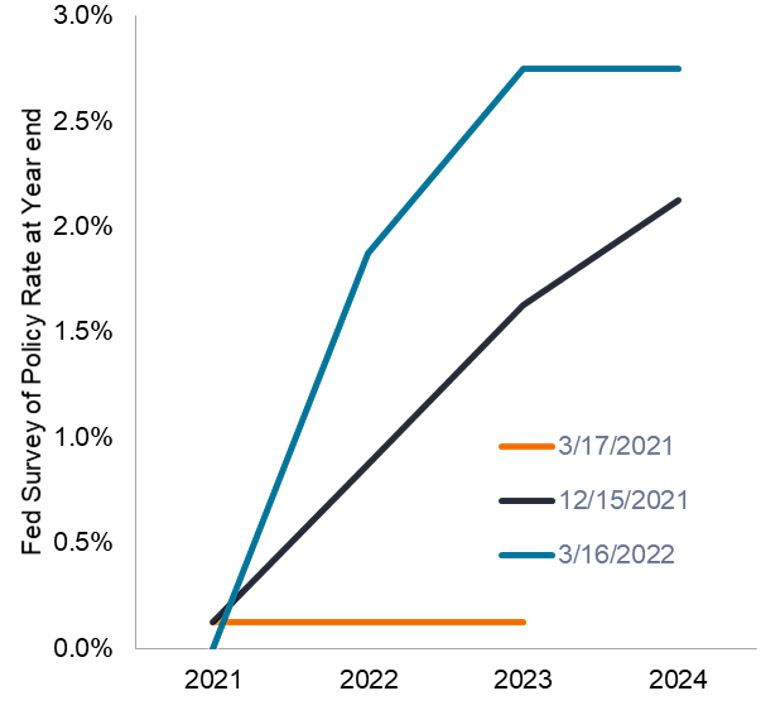
Only a year ago, the Fed foresaw no rate hikes through 2023. By its March 2022 meeting, it had revised its forecast for this period to roughly 10, including the 75 bps it has already implemented. This still lags the market’s expectations, which currently sees the equivalent of nine additional 25 bps hikes by the end of of 2023, compared to the Fed’s estimate of seven.
As evidenced by last week’s post-announcement rally and ensuing sell-off, the market has two sets of concerns: If the Fed raises rates too quickly, the risk of recession increases; however, if it fails to rein in inflation, riskier assets – not just Treasuries – are at risk of seeing the value of their future cash flows reduced. While “some” inflation can be good for stocks, the upper bound for that logic is well below 8.5%. Given these stakes, we expect asset prices to remain highly sensitive to the Fed’s forward guidance in coming months as it attempts to navigate what is likely a very narrow path.
The yield curve – flatter, just less so
One of the market barometers most sensitive to the shift in Fed policy is the US Treasuries yield curve. As expected, front-end yields have risen considerably as these maturities tend to be tethered to the overnight policy rate. The result has been a flattening curve on longer-dated points as the market began pricing in the impact that a higher cost of capital could have on future economic growth. This culminated in early April with an – albeit brief – inversion of the yield curve between 10-year and 2-year maturities.
U.S. Treasuries Curve in 2022
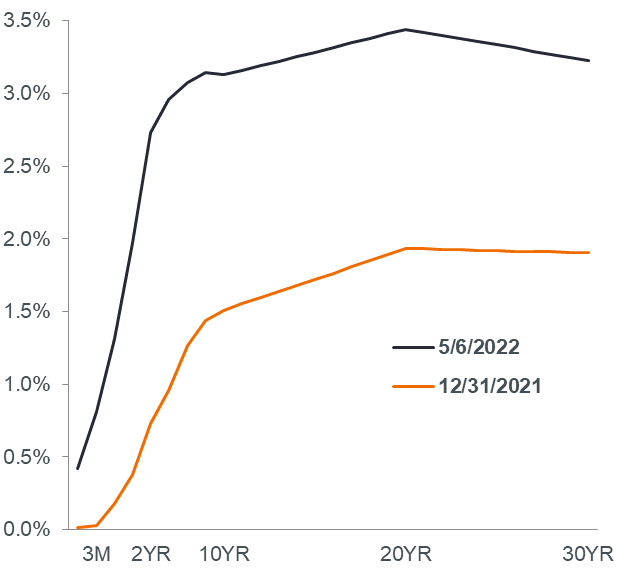
The 10-2 Spread merits monitoring as it’s viewed as a leading economic indicator. April’s inversion, therefore, hinted that the market was at least acknowledging – as with any rate-hiking cycle – recession is a potential outcome. Since then, however, the steepening of the yield curve indicates that investors are lending credence to the notion that inflation may be harder to tame than previously expected.
Those worrying that the Fed is behind the curve on inflation will want to watch whether the current 10-2 spread widens further despite well-telegraphed additional hikes. For others who believe that a soft landing remains in the cards, they will be looking for a narrowing of the 10-2 spread, along with the inflation rate implied in Treasury Inflation-Protected Securities (TIPS) maintaining their current moderating trend.
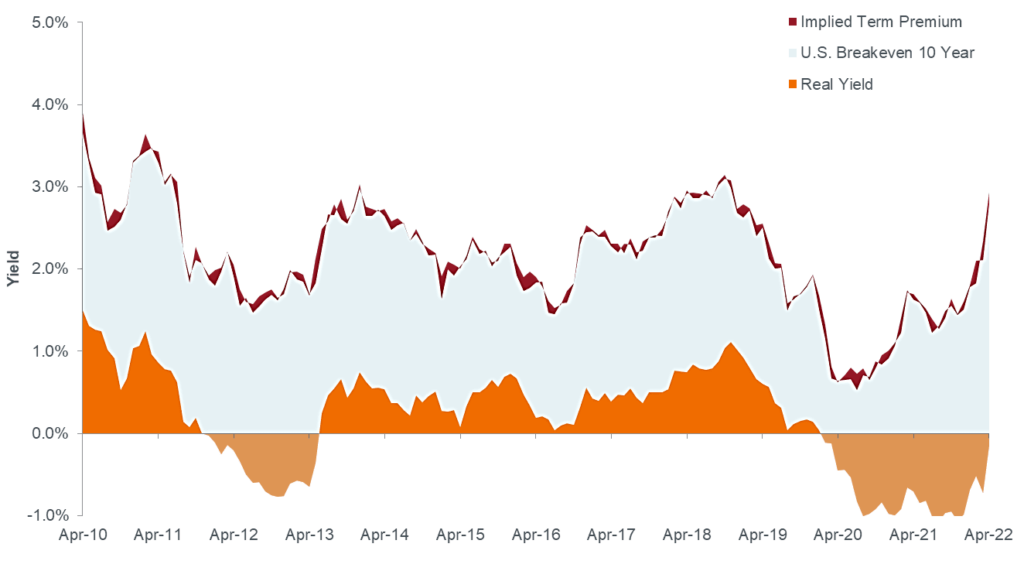
Gauging the (true) cost of capital
For almost the entirety of the COVID-19 era, the real yield on the 10-year Treasury note has been negative, plumbing as low as -1.21%. Given the risk shutdowns posed to economic growth, policymakers dusted off their GFC playbooks, cutting rates to 0% – and below – to keep capital flowing. While it’s a discussion for another day whether rates needed to stay that low well after the economy emerged from recession, real yields are on the rise now. The yield on the 10-year Treasury turned positive at the end of April, and while (still meagre) 0.27%, this represents a cost of capital much higher than only six months ago. This is a cost that matters, and such a rise is already reverberating across financial markets and the economy.
Yield Composition of the 10-Year U.S. Treasury
A higher cost of capital disincentivises debt-driven spending by businesses and households. That’s the point, though, as the Fed seeks to dampen demand’s contribution to inflation. The typical lag it takes for this mechanism to be transmitted through the economy may be prolonged during this cycle given the levels of cash on corporate and household balance sheets. This adds more complexity to the Fed’s task of striking the right balance between managing inflation and scuttling the recovery.
Within markets, higher rates’ most immediate effect has been the 10.5% year-to-date loss on the benchmark Bloomberg US Aggregate Bond Index. Some solace can be found in investors no longer having to sacrifice positive real returns for liquidity, at least on longer-dated securities. While still negative, the -0.14% TIPS 5-year breakeven inflation rate is notably higher than its March level of -1.75%. The timing of when positive real yields return to shorter-dated Treasuries will depend upon the cadence of rate hikes and whether inflation driven by disparate forces proves too tricky to easily tame.
Equities adjust
As evidenced by this year’s sell-off, stocks have not been immune to changes in monetary policy. What fuelled equities over the past two years is also what made them acutely vulnerable to rising rates. The growth stocks that have dominated markets derive much of their value from expected cash flows still years away. A higher discount rate reduces the present value of these cash flows and subsequently puts downward pressure on their valuation multiples.
Total 2022 Return Decomposition for S&P 500® Index and Select Sectors
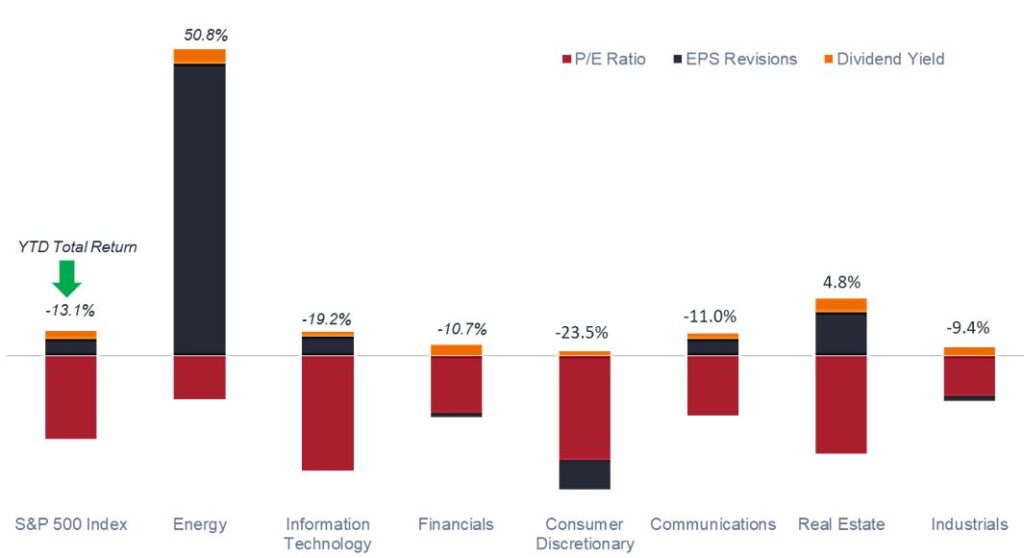
Thus far, the simple math of equity valuation has been the main source of this year’s negative stock returns as price-earnings (P/E) multiples compressed. Importantly, corporate earnings have thus far proven resilient, buoyed by a labour market that has returned nearly all the jobs lost during the pandemic. Full-year 2022 earnings have been revised slightly upward and, with almost 90% of S&P 500 constituents having reported results, both revenue and earnings have beaten expectations.
Still, risks remain. As evidenced by the market’s second thoughts on last week’s “cautious” 50 bps rate increase, runaway inflation can be just as damaging to equities’ prospects as they can to bonds. This can occur either through lower earnings in inflation-adjusted returns, or through actual losses as the combination of demand destruction and higher input costs exert downward pressure on earnings.
With earnings estimates having, thus far, held up, investors will want to gauge the health of consumers’ and businesses’ willingness to spend. This will largely dictate whether corporate bottom lines continue to grow. How inflation contributes to shifts in spending habits can provide insight into where opportunities exist for undervalued securities.
As evidenced by a steepening yield curve, recession does not appear imminent. Still, history shows that the central risk of a central bank being behind the curve is that it must play catch-up by raising rates to such a degree that recession is unavoidable. A potential warning signal can be seen in another risky asset class: high-yield corporate bonds. Even with strong balance sheets, the spread between their yields and those of their risk-free benchmarks have risen 30% in the past month.
Equity securities are subject to risks including market risk. Returns will fluctuate in response to issuer, political and economic developments.
High-yield or “junk” bonds involve a greater risk of default and price volatility and can experience sudden and sharp price swings.
U.S. Treasury securities are direct debt obligations issued by the U.S. Government. With government bonds, the investor is a creditor of the government. Treasury Bills and U.S. Government Bonds are guaranteed by the full faith and credit of the United States government, are generally considered to be free of credit risk and typically carry lower yields than other securities.
Growth stocks are subject to increased risk of loss and price volatility and may not realize their perceived growth potential.
Inflation-linked bonds feature adjustments to principal based on inflation rates. They typically have lower yields than conventional fixed-rate bonds and decline in price when real interest rates rise.
A yield curve plots the yields (interest rate) of bonds with equal credit quality but differing maturity dates. Typically bonds with longer maturities have higher yields.
Volatility measures risk using the dispersion of returns for a given investment.
Dividend Yield is the weighted average dividend yield of the securities in the portfolio (including cash). The number is not intended to demonstrate income earned or distributions made by the portfolio.
Price-to-Earnings (P/E) Ratio measures share price compared to earnings per share for a stock or stocks in a portfolio.
Bloomberg U.S. Aggregate Bond Index is a broad-based measure of the investment grade, US dollar-denominated, fixed-rate taxable bond market.
S&P 500® Index reflects U.S. large-cap equity performance and represents broad U.S. equity market performance.