
Key Takeaways
- OPEC+ announced a taper of the additional voluntary supply cuts earlier than expected and gave the UAE more oil quota to form its baseline.
- Oil markets fell on this news, but have likely hit a floor.
- That floor is underpinned by a combination of technicals and buying behaviour by the US government to refill strategic reserves.
- Related ProductsWisdomTree Brent Crude Oil, WisdomTree Bloomberg Brent Crude Oil, WisdomTree WTI Crude Oil, WisdomTree EnergyFind out more
The Organization of the Petroleum Exporting Countries and its partner countries (jointly OPEC+) announced their latest production decision on Sunday 2nd June 2024. While the initial headline of rolling cuts to December 2025 sounded positive, the detail offered a more nuanced picture and one that oil markets did not like. The cuts that have been rolled over to end of December 2025 were only initial voluntary cuts, amounting to 1.66 million barrels per day (mb/d) that were first announced in April 2023. The more meaningful additional 2.2 mb/d cuts announced in November 2023 will only be extended to September 2024 before being gradually tapered to zero by September 2025. We had hoped that that the 2.2 mb/d commitment would be extended in full to end of 2024. OPEC+ provided a surprisingly detailed table of month-by-month production targets for each of the eight countries participating in the voluntary cuts1. The United Arab Emirates UAE also appears to have gained an extra 300 thousand barrels per day of production quota that is to be phased in between January 2025 and September 2025. The key take-away is that OPEC+ is set to produce more than the market was expecting.
Baseline debacle continues
That the UAE managed to increase its quota, could reflate frictions between OPEC+ members that bubbled to the surface last year. In December 2023 Angola left OPEC over a disagreement about production quotas. Angola was upset that the UAE had its quota widened while Angola was under pressure to tighten its production following the review of independent assessors about overall production capacity. In 2023 Angola, Nigeria and the Republic of Congo had their production capacities assessed by third parties to form a new ‘baseline’. Other OPEC countries were to have their baseline capacities assessed by independent parties this year, but the deadline for the assessment has been extended to November 2025 after last week’s OPEC+ meeting.
Spot price declines do not alter the positive roll yield story
The prospect of higher supplies has not been well received by markets. Brent and WTI oil prices fell 4.0% and 3.6% respectively between the Friday 31/5/2024 and Monday 3/6/2024 (end of day)2.
Oil prices have largely traded in a range over the past year. $67-$94 per barrel for WTI and $72-97 per barrel for Brent. As we discussed in our What’s Hot discussion last week3, range trading has not necessarily been bad for rolling futures investors on account of the positive roll yields in a market with oil futures curves in backwardation. Despite the disappointing decision by OPEC+, the oil futures curve remains in a state of backwardation, with more near-term tightness priced into the markets. The implied roll yield at the front of both Brent and WTI oil curves have not materially changed.4
Hitting new support levels?
We have now moved close to the bottom of the trading range. Looking at Fibonacci retracements, we are basically at the 23.6% level for both Brent and WTI, indicating that a support level could have been reached5.
We note that WTI oil is now below $79/bbl – which is another key marker – not driven by markets but the U.S. government. In 2022 the Biden Administration sold 180 million barrels of oil over six months from the U.S.’s Strategic Petroleum Reserve (SPR). A further sale of 38 million barrels had been mandated by Congress. The U.S. SPR is the largest stockpile of oil, created in 1975 by Former President Gerald Ford after the Arab oil embargo drove oil scarcity and spiked prices. The SPR’s purpose was mainly to provide a source of oil when other oil assets are under pressure, for example from hurricane damage or physical attacks. The sale in 2022 was a coordinated action by the OECD in response to the energy crisis brought on by the Russia-Ukraine war. Selling out of the SPR continued into mid-2023, with the stock having fallen over 40% since the end of 2021.
However, since then, the Biden Administration has ordered the buying of oil to replenish the SPR. Moreover, it has been explicit that it has a price target of WTI oil price below $79/bbl to make these purchases. At the time of writing (7/6/2024) WTI oil price is $75/bbl.
As the graph below shows, the U.S. has a long way to go to get back to pre-Ukraine war levels of SPR. However, through a combination of cancelling congressionally-mandated sales (140 million barrels) and opportunistic purchases, the Administration plans to replenish its supply. We believe that the latter, periodic buying will help enforce a WTI price floor in the high $70s/bbl. At prices above that floor, the U.S. government has avoided purchases. In April 2024 when WTI was in trading in the 80s, the Department of Energy cancelled two proposed solicitations for 1.5 million barrels each for delivery in September 2024. Now we are back below $79/bbl, the Department of Energy will likely accelerate purchases once again, helping to strengthen the floor.
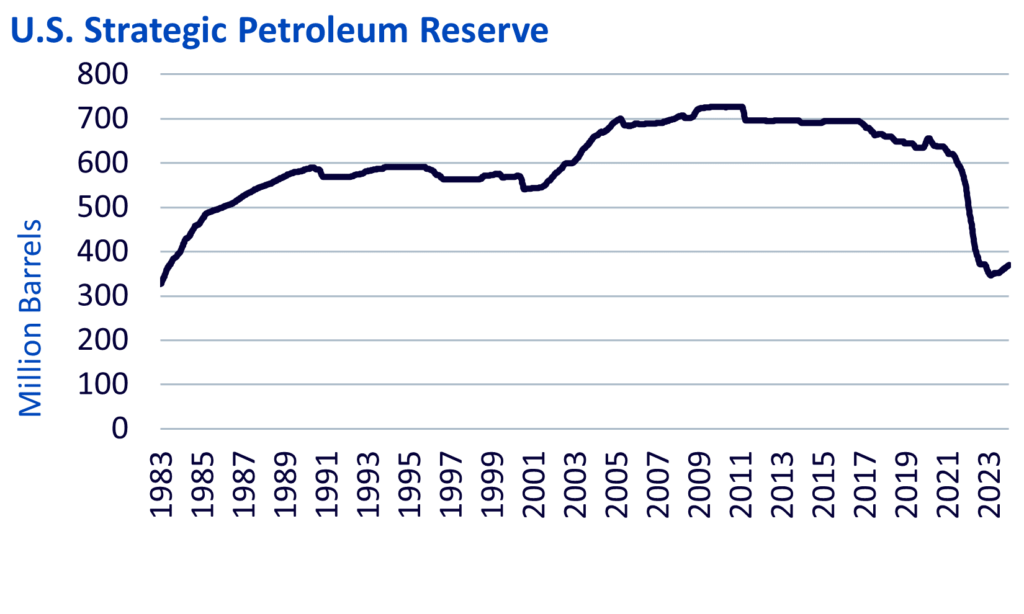
Source: WisdomTree, Energy Information Agency. June 1983 to May 2024. Forecasts are not an indicator of future performance and any investments are subject to risks and uncertainties.
Conclusion
After oil prices declined last week, we believe both Brent and WTI are close to a floor. Moreover, both oil futures curves are in a state of backwardation, which we believe will continue to provide a positive return for rolling futures strategies.
1 See https://www.opec.org/opec_web/en/press_room/7339.htm
2 All price levels and references in this article are sourced from Bloomberg using front month future prices.
3 What’s Hot: OPEC+ poised to rollover production cuts and keep oil futures in backwardation
4 Implied roll yields from the front to second contract for Brent went from 0.6% to 0.4% and remained around 0.3% for WTI between 31/05/2024 and 06/06/2024.
5 Fibonacci retracements are used by technical analysts to assess attractive potential entry/exits points. Key inputs are the range of prices over the past year and then levels of 23.6%, 38.2%, 61.8%, 76.4% across that range as key markers that represent either a resistance or support level. While we don’t believe that these markers are linked to supply and demand fundamentals, the fact that many use them for entry/exits timing can sometimes influence trading activity.