It’s a topical concern that keeps on worrying investors in US stocks. The US equity market undoubtedly includes some of the world’s most dynamic and fastest-growing companies. After the outstanding performance of large US stocks in 20231 – and especially the Magnificent Seven tech stocks featured in my last column – investors are wondering whether their valuations are still reflecting fair value or are potentially based on a hype caused by the rise of Artificial Intelligence.
To address the above-mentioned concerns, we partnered with the investment research firm Morningstar, which has developed a concept of Moat Investing. According to Morningstar, Moats are structural competitive advantages that allow a company to generate returns on invested capital (ROIC) in excess of its weighted average cost of capital (WACC) for extended periods. The wider the Moat is, the longer the company can sustain its competitive advantages.
Five Different Types of Moat
Morningstar identifies five different types of moats that companies possess. These are:
- Switching costs. The time or money that it takes a customer to switch from one producer/provider to another.
- Intangible assets. Things like such as brands, patents and regulatory licenses that block competition and/or allow companies to charge more.
- Network effect. Present when the value of a service grows as more people use a network.
- Cost advantage. This allows firms to sell at the same price as competition and gather excess profit and/or have the option to undercut competition.
- Efficient scale. When a company serves a market that’s limited in size, new competitors may not have an incentive to enter.
In order to build a basket of stocks that should outperform, Morningstar has built an index of stocks that not only have wide economic moats but are also attractively priced. It uses a discounted cashflow model to estimate fair value, adding stocks that appear cheap and removing those that look expensive.
Over the past 17 years, the Morningstar Wide Moat Focus Index has outperformed the S&P 500 index consistently as the charts below show.
History of Outperformance
Cumulative Return (%) / 28/02/2007 – 31/12/2023
Performance data quoted represents past performance. Past performance is not a guarantee of future results. Index performance is not illustrative of fund performance. For fund performance current to the most recent month-end, visit vaneck.com.
At VanEck, we have based ETFs on the Morningstar index for some time. For instance, we offer the VanEck Morningstar US Sustainable Wide Moat ETF. To complement this, we launched the VanEck Morningstar US Wide Moat ETF at the beginning of 2024. This ETF does not have a specific sustainability screen and tracks the Morningstar index This index is equally-weighted and therefore avoids the high levels of stock concentration in the S&P 500, while providing exposure to undervalued securities2. Please remember that the financial markets are constantly changing and investing in equities is risky.
Despite Recent Outperformance, the Index Continues to Offer an Attractive Discount to Fair Value
Time Period: 1/1/2014- 31/12/2023
Methodology: Weighted avg. P/FVE via security-level weightings in portfolio
Source: Morningstar Direct
Indexes are unmanaged and not available for direct investment
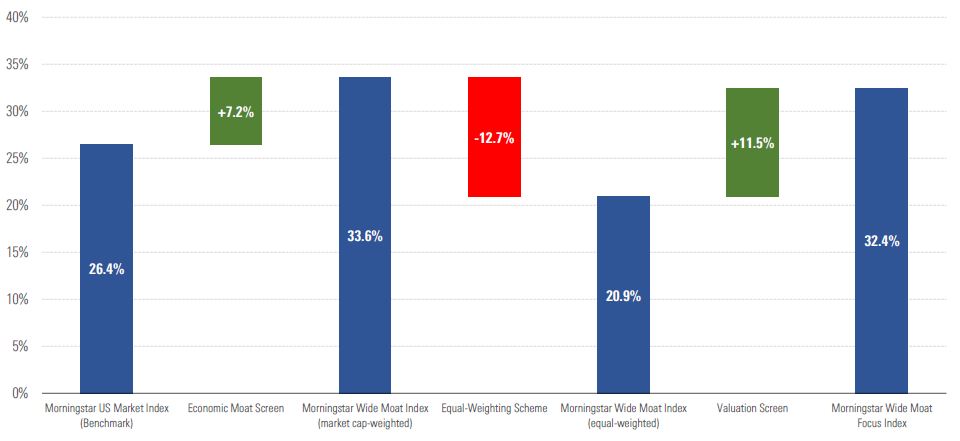
With the “Magnificent 7” stocks having driven over half of the broad market’s total returns in 2023, equal-weighted indices faced a performance headwind. Indeed, the Morningstar Wide Moat Index, a market cap-weighted index of all U.S. wide moat-rated stocks, outperformed its equal-weighted counterpart (as seen in the two middle blue bars below). However, the Morningstar Wide Moat Focus Index, which in addition to screening for wide-moat U.S. stocks also has a valuation screen, has historically outperformed its benchmark consistently. This historical performance is by no means a guarantee for future performance and investors in equity funds should consider the risk of (subastantial) capital loss.
The Index Overcame a Stiff Performance Headwind From Its Equal-Weighting Approach

Time Period: 1/1/2023 – 31/12/2023
Source: Morningstar Direct
Indexes are unmanaged and not available for direct investment
For those investors who prefer to buy US mid- and small-capitalization stocks, we have also launched the VanEck Morningstar US SMID Moat ETF. Over the long term — more than 20 years — US small and mid-sized (SMID) stocks have outperformed the large-cap market, but their valuations are now close to 20-year lows relative to large caps when valued on the well-known price/earnings ratio, according to Morningstar. Some investors might think it’s time that the discount was narrowed. Further, there is evidence that this area of the stock market is inefficient, leaving more scope for Morningstar analysts to find companies with wide moats that could potentially be trading at a discounted price.
SMID Cap Forward P/E Relative to Large Cap Forward P/E
JANUARY 2004 – DECEMBER 2023
The US economy hosts some of the world’s most dynamic businesses that are shaping the future of our economy. However, after last year’s exceptional investment gains, they are trading at high P/E multiples which may pose a threshold and defer investors from investing in them. Buying stocks with wide economic moats could be one way of countering that conundrum.
2 Based on Morningstar’s Equity Research. More than 100 analysts conduct company and industry research. Analyst rates the strength of competitive advantage, or moat: None, Narrow or Wide. Analyst uses discounted cash flow model to develop a Fair Value Estimate which represents the intrinsic value that company.

